Diagrams and infographics
See how the ideas fit together
107 original diagrams: models, processes, structures and charts across the five units and the toolkit, 30 of them for HL, and 10 enrichment frameworks beyond the course. 17 of them do more than show: you can change their figures, compare two cases, switch views or explore each part. Each is drawn from data, with a text description, an SVG download and a print view; 53 are drawn again for phones, and the rest fit the screen and can be shown larger. Charts use fictional figures, and say so.
Section 01: Unit 1: Introduction to business management
-
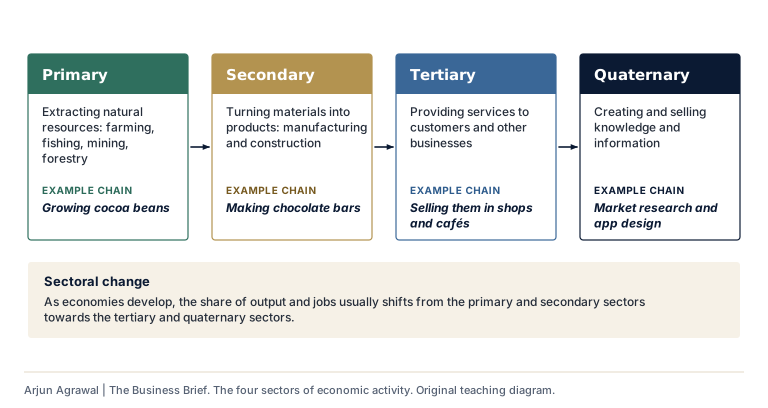
The four sectors of economic activity
From extracting resources to selling knowledge, with one chain of production.
-
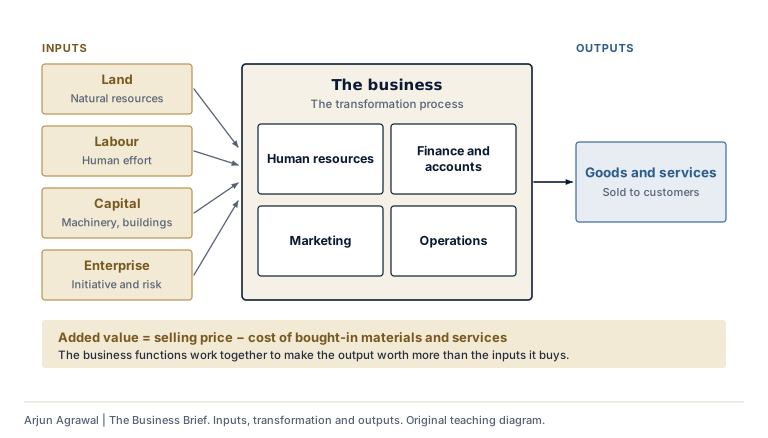
Inputs, transformation and outputs
The factors of production, the four business functions and added value.
-
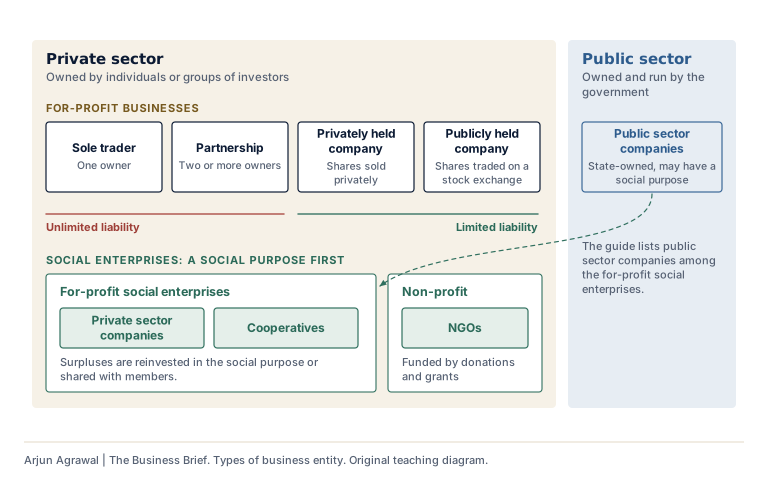
Types of business entity
Private and public sectors, liability, and the social enterprises the guide names.
-
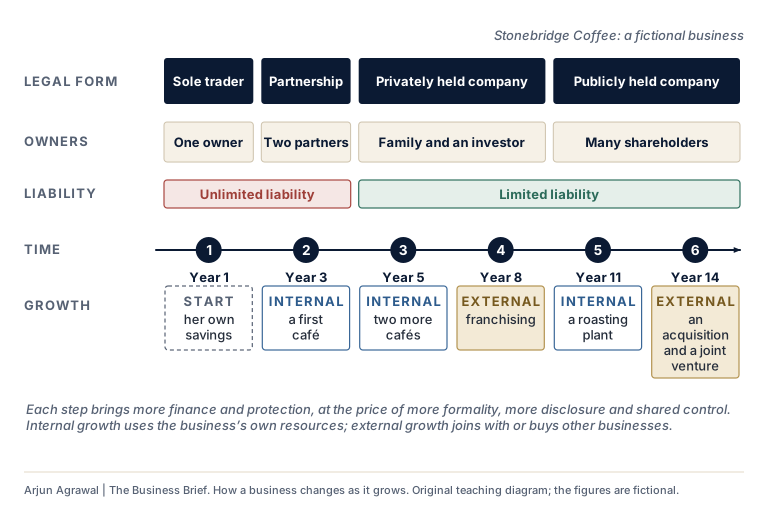
How a business changes as it grows
Legal form, owners, liability and method of growth for a fictional business over fourteen years.
-
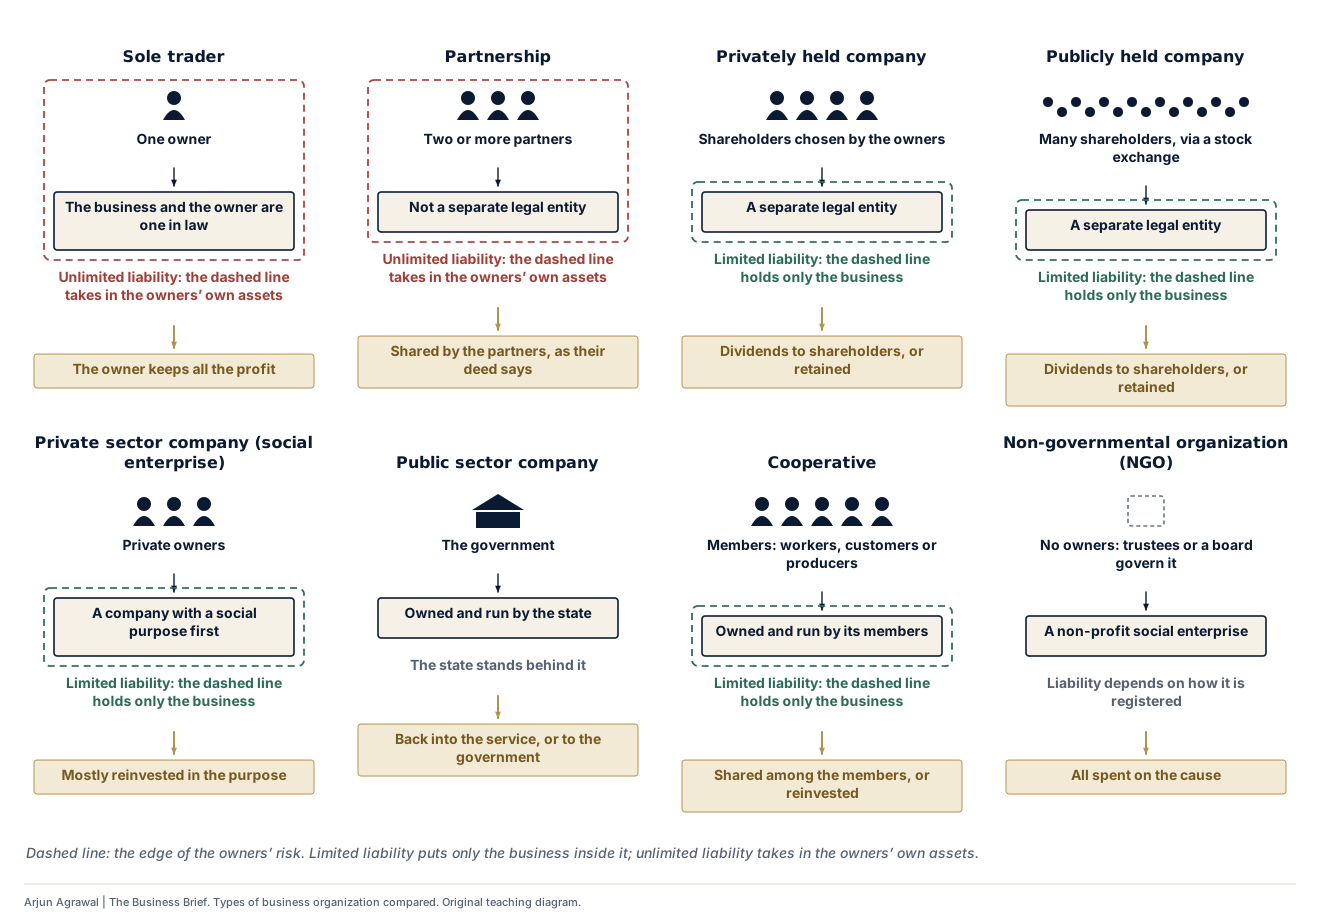
Types of business organization compared
Owners, liability and where the profit goes, for each type the guide names: choose two to set side by side.
-
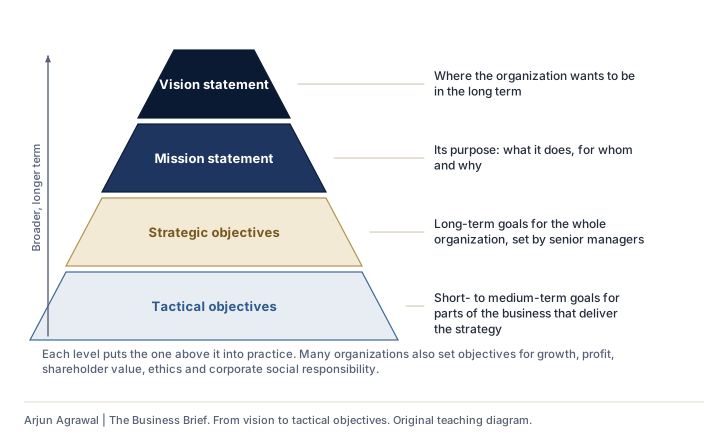
From vision to tactical objectives
How vision, mission, strategic and tactical objectives fit together.
-
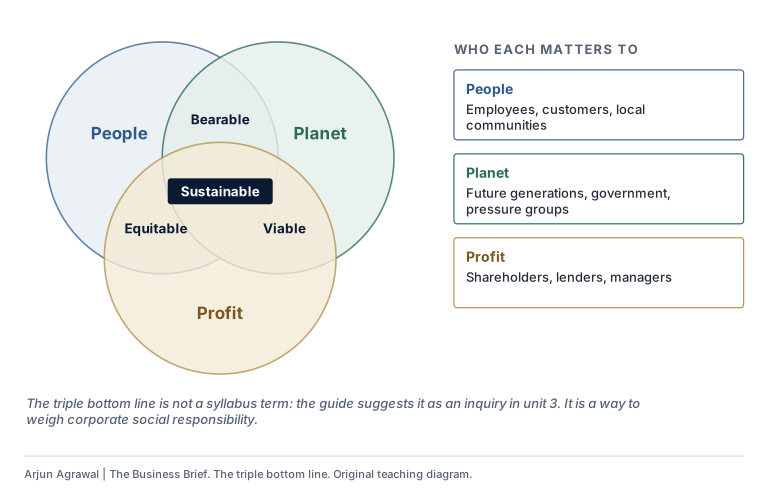
The triple bottom line
People, planet and profit, the overlaps between them, and the stakeholders each matters to most.
-
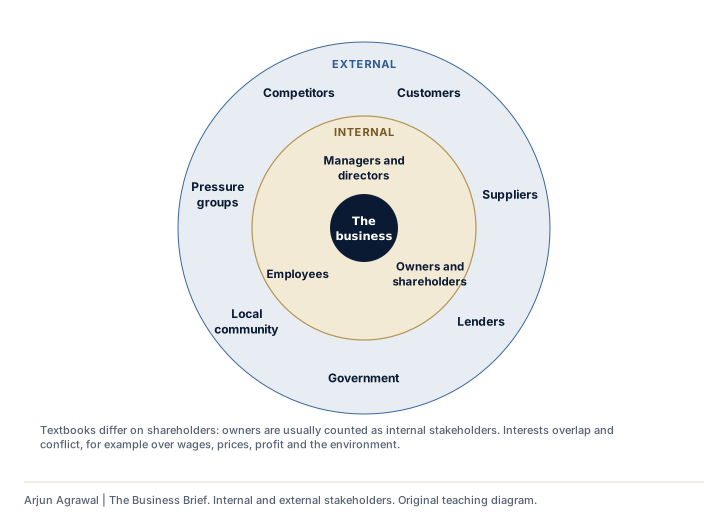
Internal and external stakeholders
Who has a stake in the business, from the inside out.
-
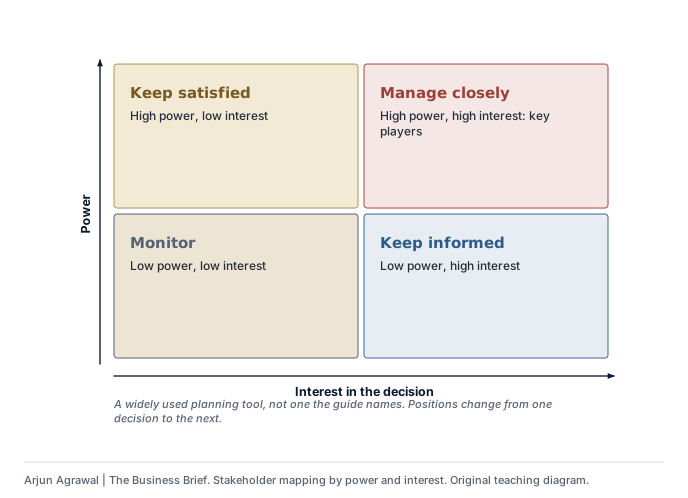
Stakeholder mapping by power and interest
A planning tool for deciding how to treat each group in a decision.
-
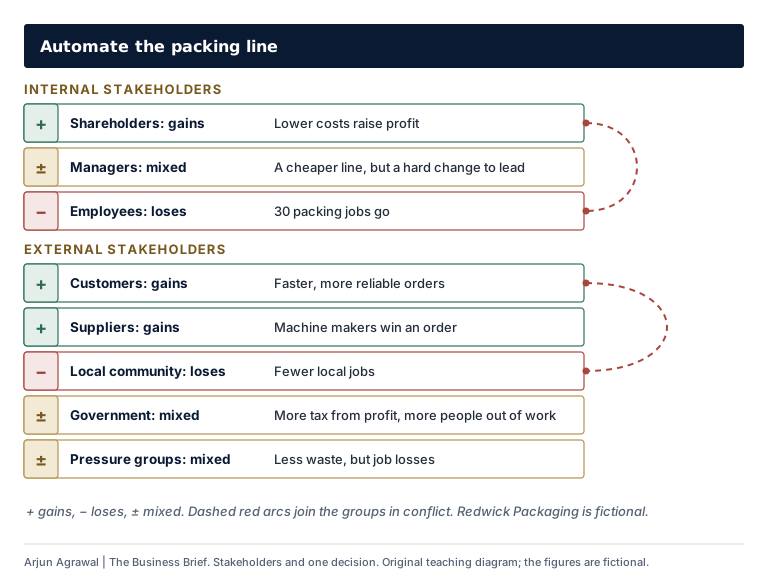
Stakeholders and one decision
Who gains and who loses from three decisions at a fictional manufacturer, and where they conflict.
-
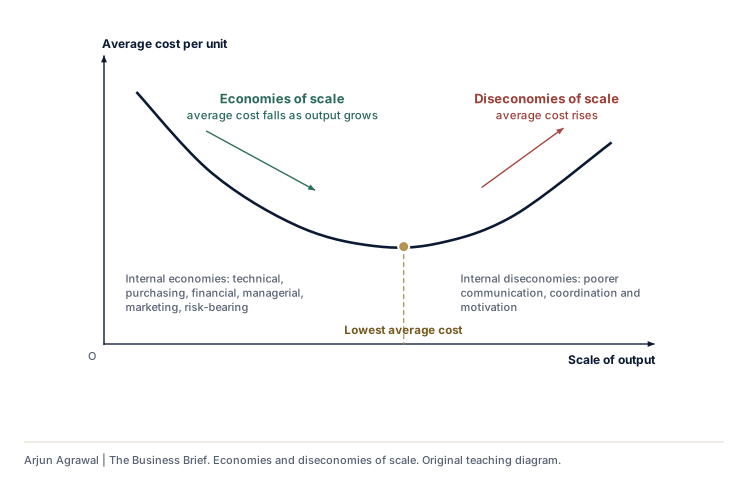
Economies and diseconomies of scale
Average cost falls, bottoms out and rises as a business grows.
-
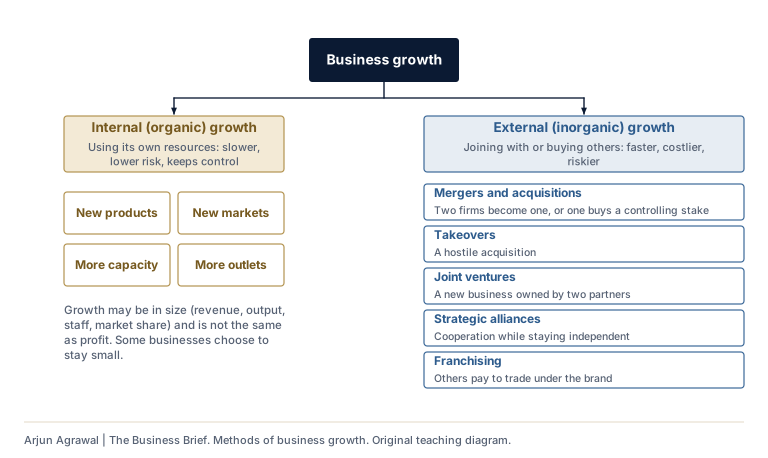
Methods of business growth
Internal growth and the five external methods the guide names.
-
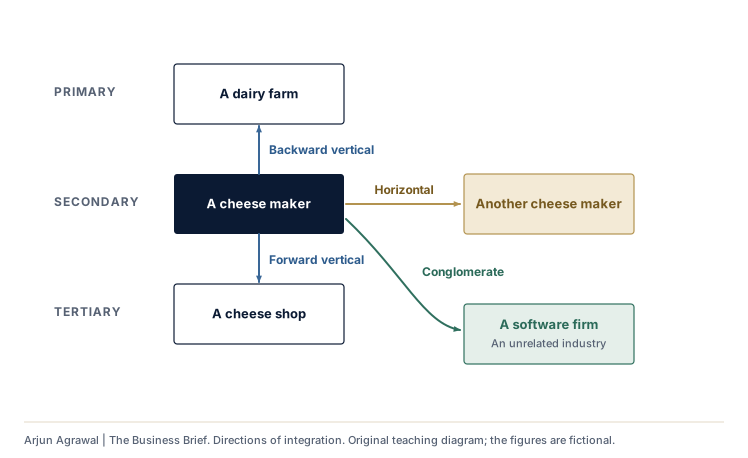
Directions of integration
Horizontal, backward and forward vertical, and conglomerate, for one fictional business.
-
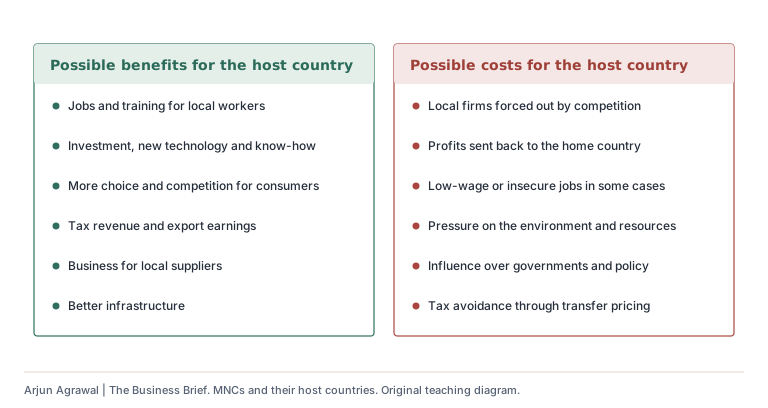
MNCs and their host countries
The possible benefits and costs to weigh.
Section 02: Unit 2: Human resource management
-
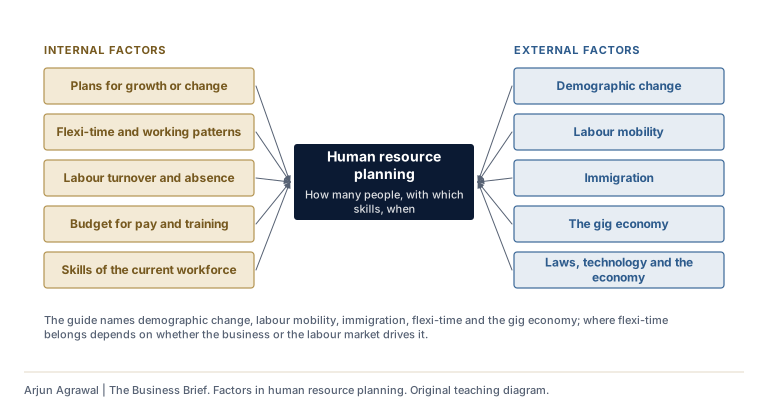
Factors in human resource planning
The internal and external factors that shape how many people a business needs.
-
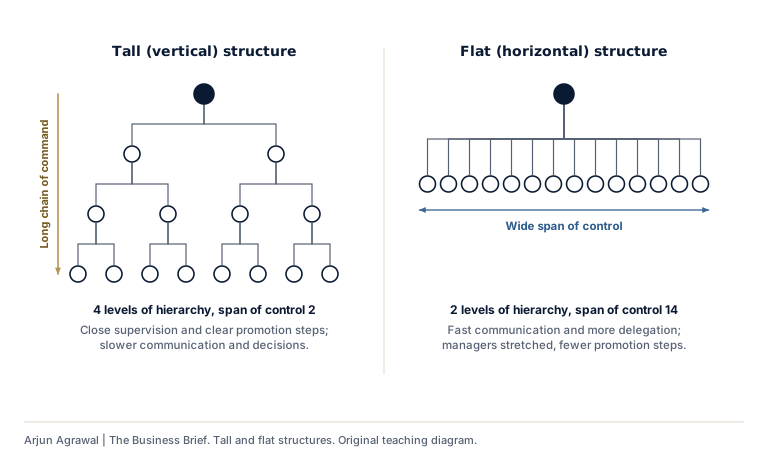
Tall and flat structures
Levels of hierarchy, span of control and chain of command compared.
-
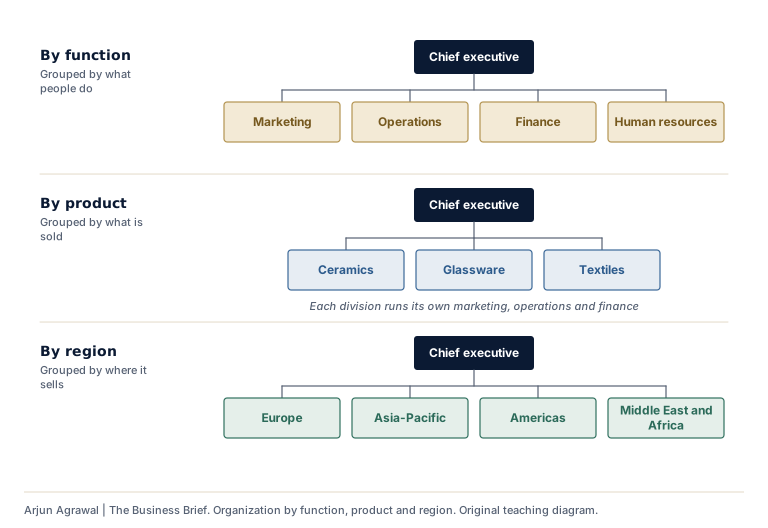
Organization by function, product and region
Three ways to group the same business.
-
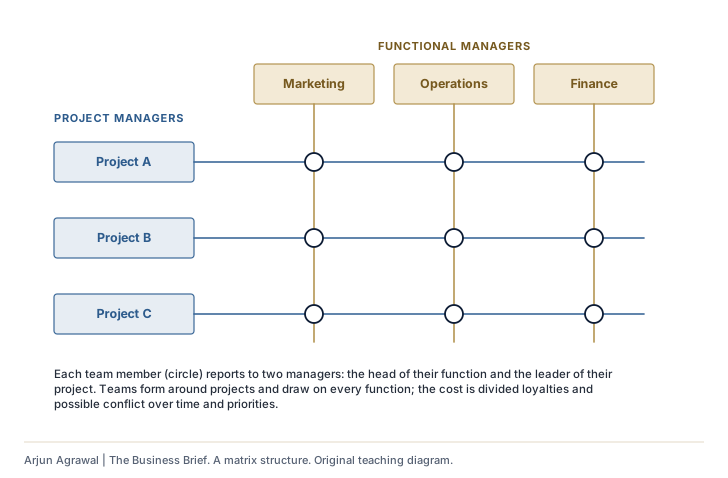
A matrix structure
Project teams that draw on every function, each member with two managers.
-
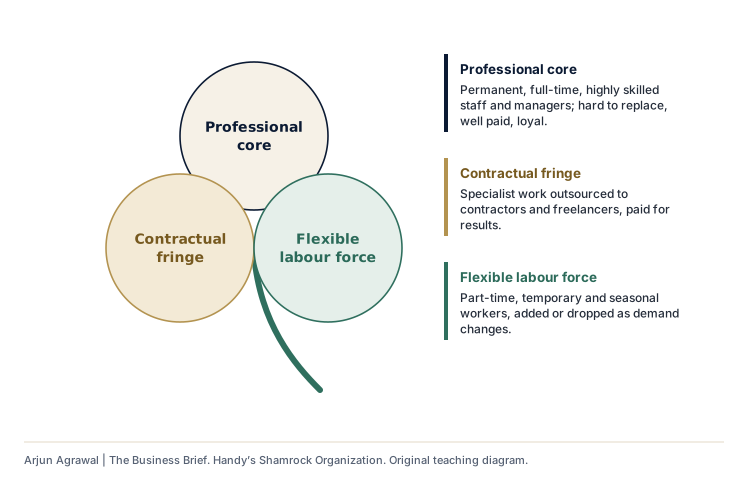
Handy’s Shamrock Organization
A professional core, a contractual fringe and a flexible labour force.
-
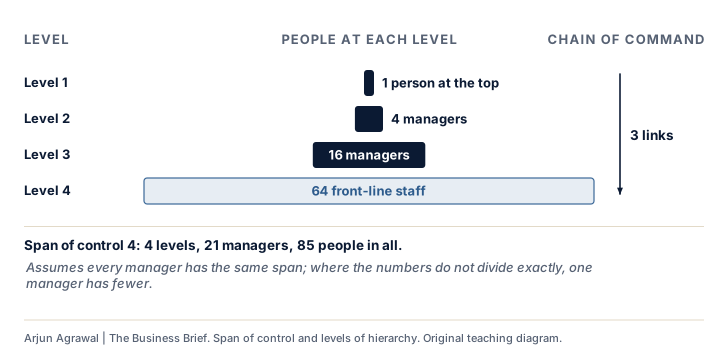
Span of control and levels of hierarchy
Change the span of control and see the levels, the managers and the chain of command change with it.
-
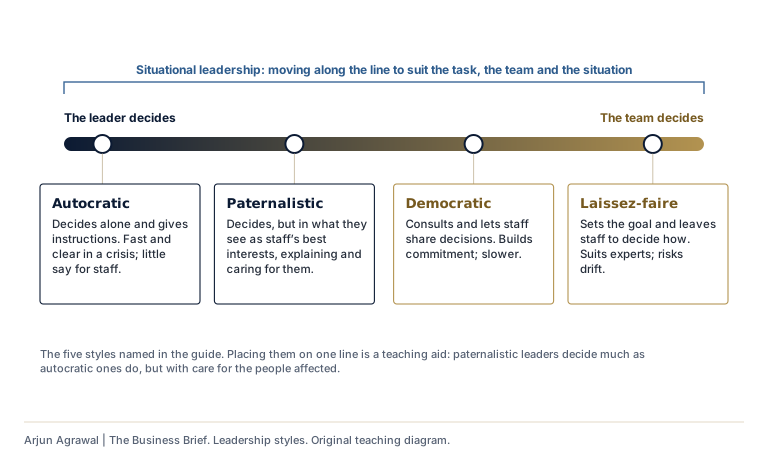
Leadership styles
The five styles in the guide, from the leader deciding to the team deciding.
-
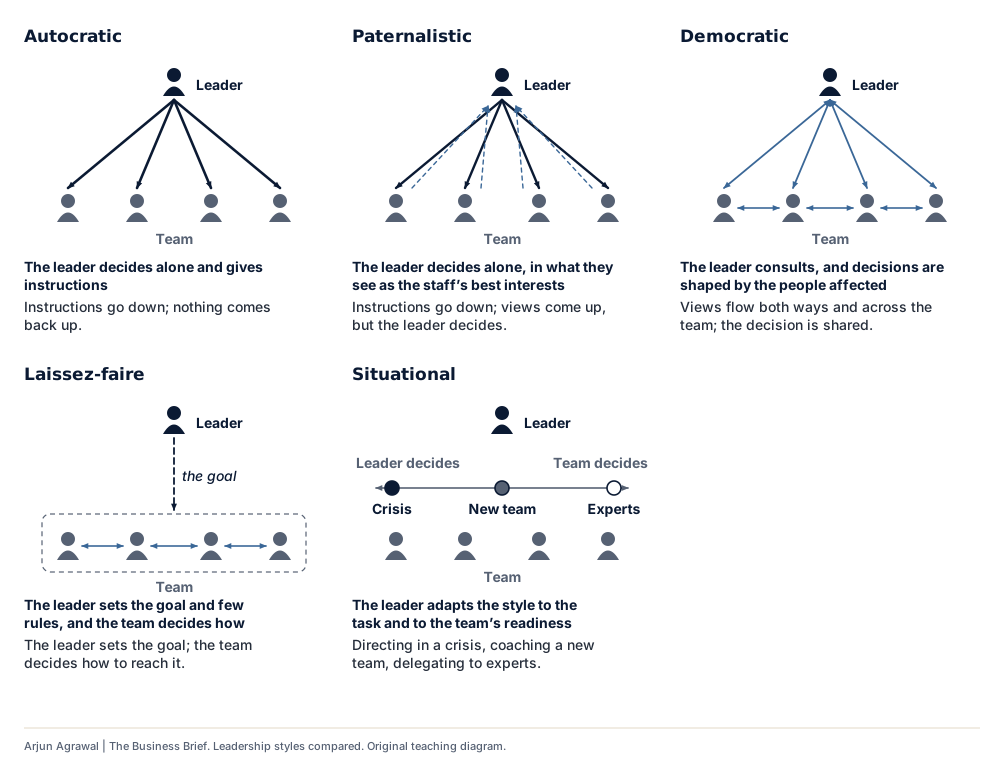
Leadership styles compared
Who decides, and which way communication runs, in each of the five styles: choose two to set side by side.
-
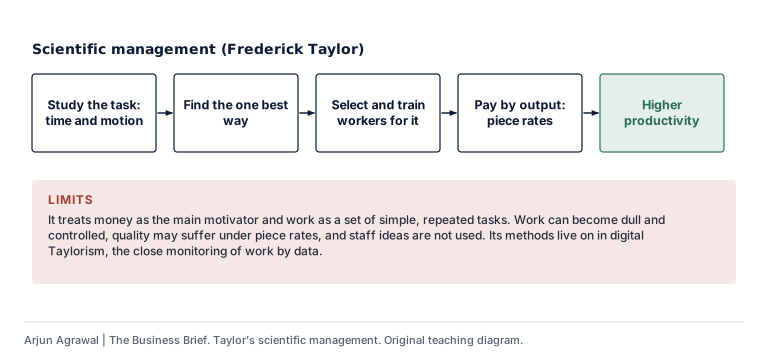
Taylor’s scientific management
The one best way, piece rates, and the limits of both.
-
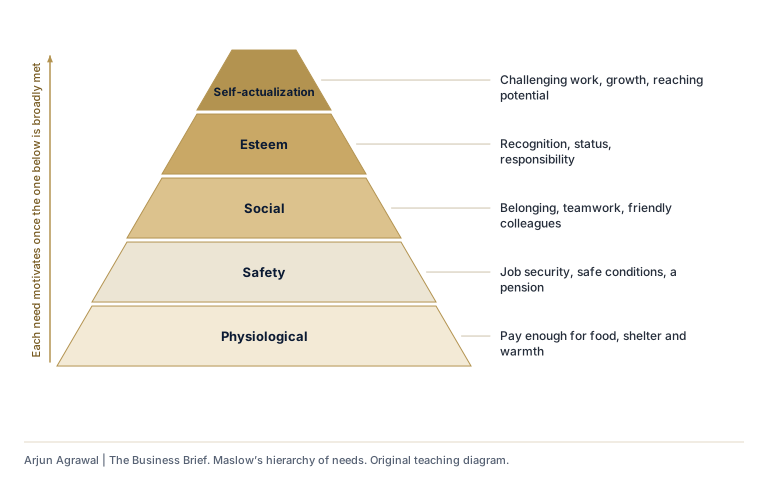
Maslow’s hierarchy of needs
Five levels of need, with workplace examples.
-
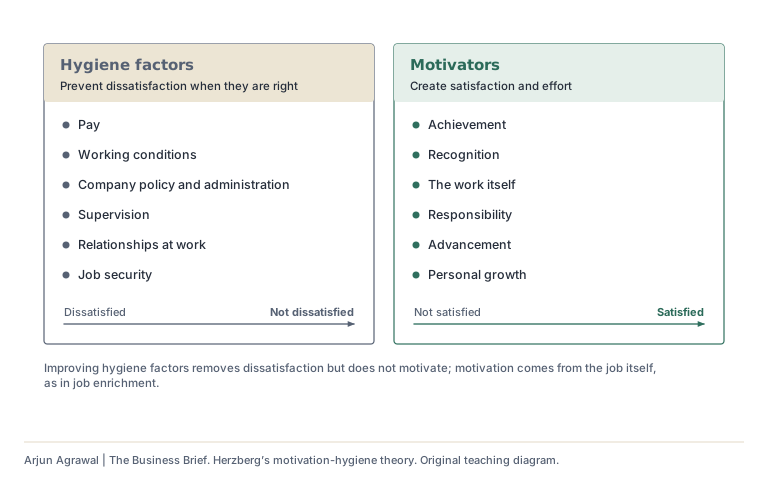
Herzberg’s motivation-hygiene theory
What prevents dissatisfaction is not what motivates.
-
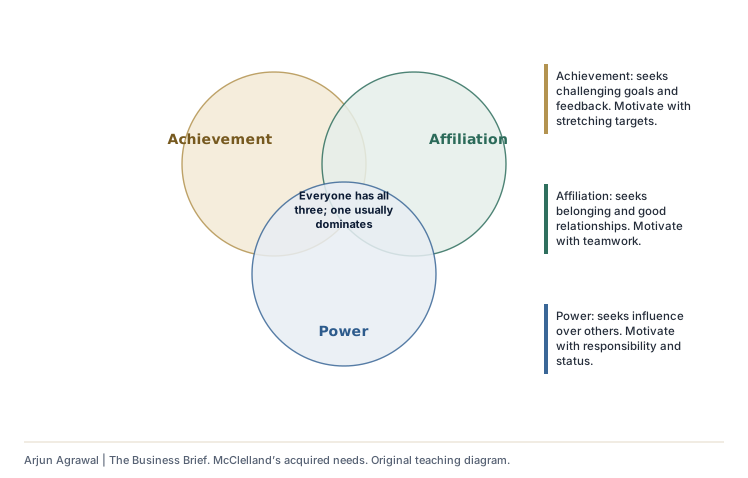
McClelland’s acquired needs
Achievement, affiliation and power.
-
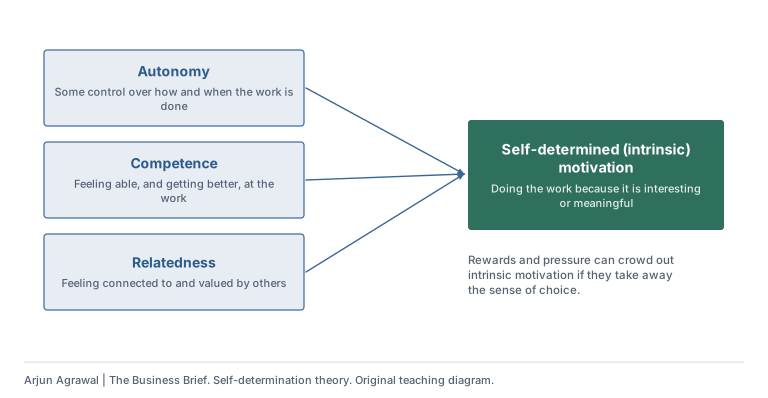
Self-determination theory
Autonomy, competence and relatedness feed intrinsic motivation.
-
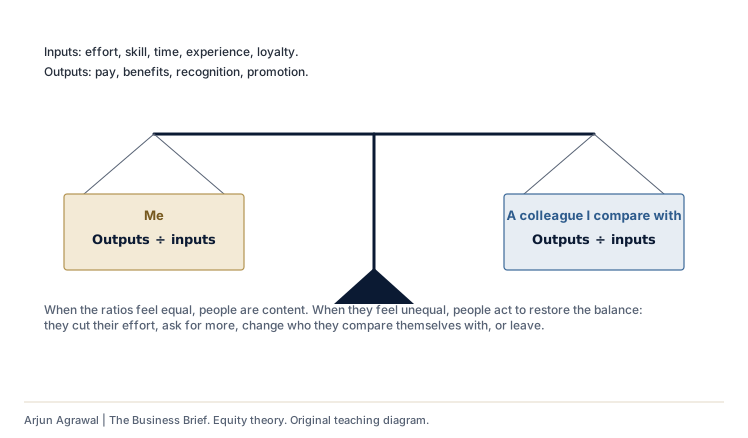
Equity theory
Comparing what we put in and get out with someone else.
-
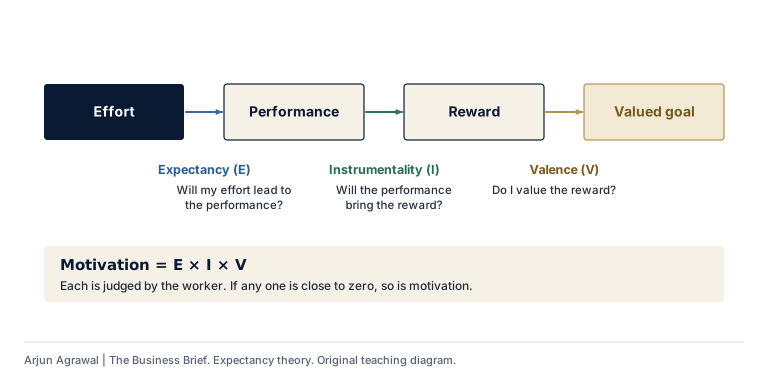
Expectancy theory
Expectancy, instrumentality and valence, multiplied.
-
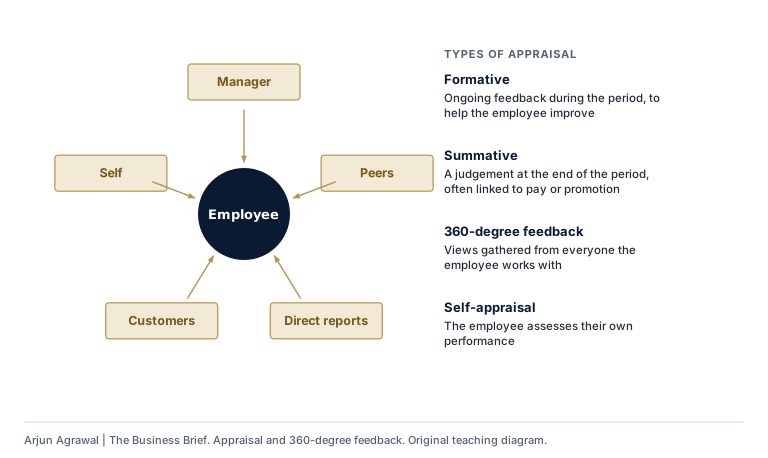
Appraisal and 360-degree feedback
The four types of appraisal in the guide.
-
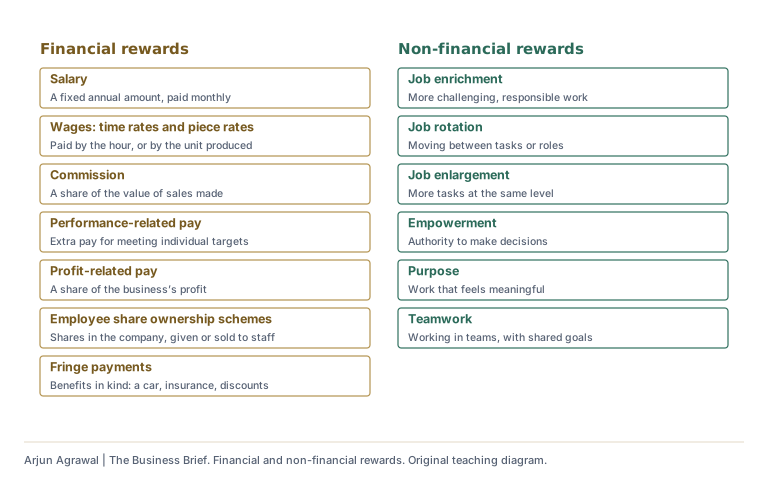
Financial and non-financial rewards
Every reward the guide names, with a line on each.
-
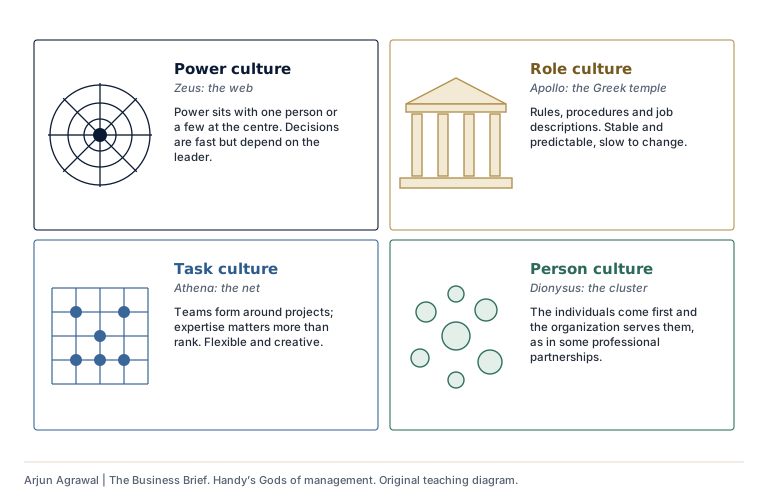
Handy’s Gods of management
Power, role, task and person cultures, with their images.
-
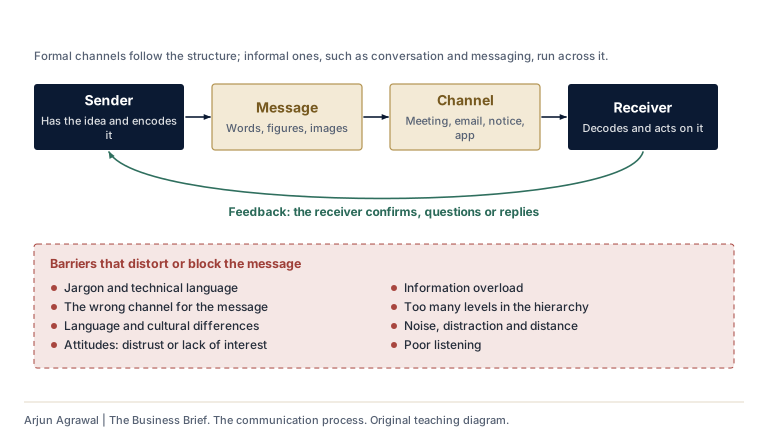
The communication process
Sender, message, channel, receiver, feedback, and the barriers in between.
-
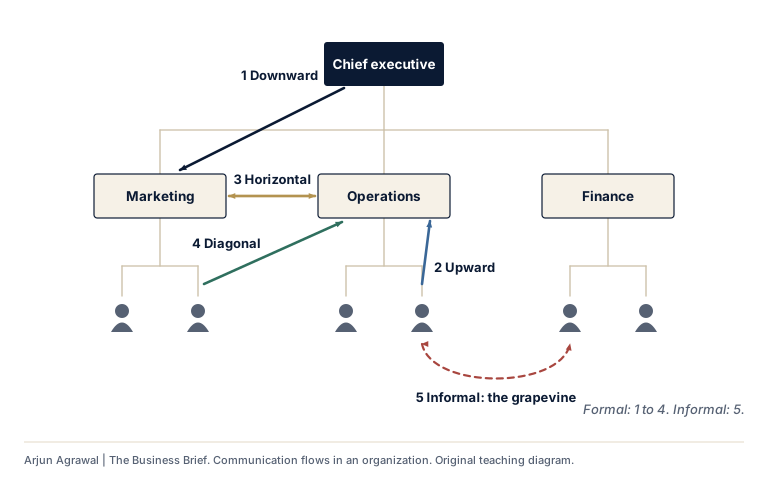
Communication flows in an organization
Downward, upward, horizontal, diagonal and informal communication on one organization chart.
-
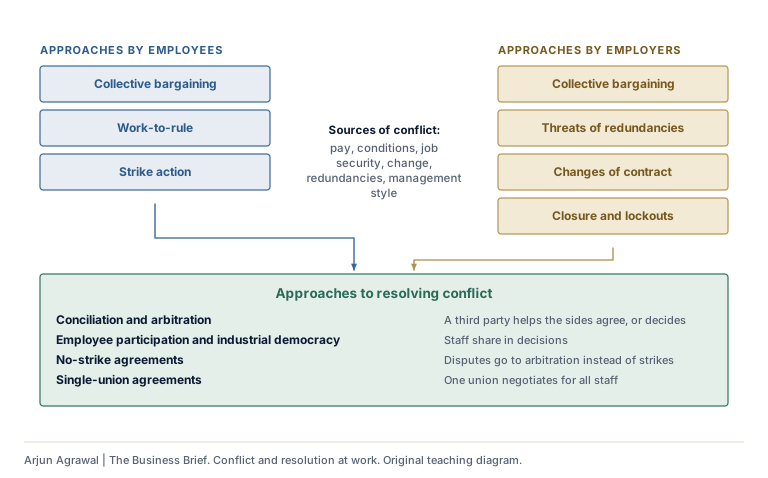
Conflict and resolution at work
Approaches by employees and employers, and the routes to agreement.
Section 03: Unit 3: Finance and accounts
-
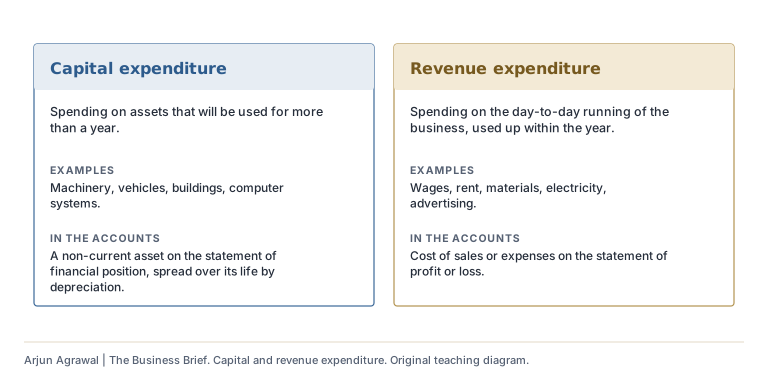
Capital and revenue expenditure
Long-lived assets against day-to-day spending, and where each appears in the accounts.
-
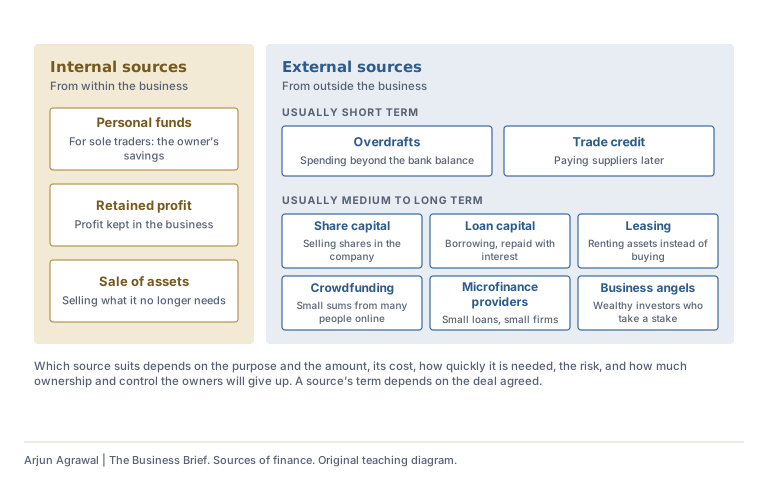
Sources of finance
Internal and external sources, by their usual term.
-
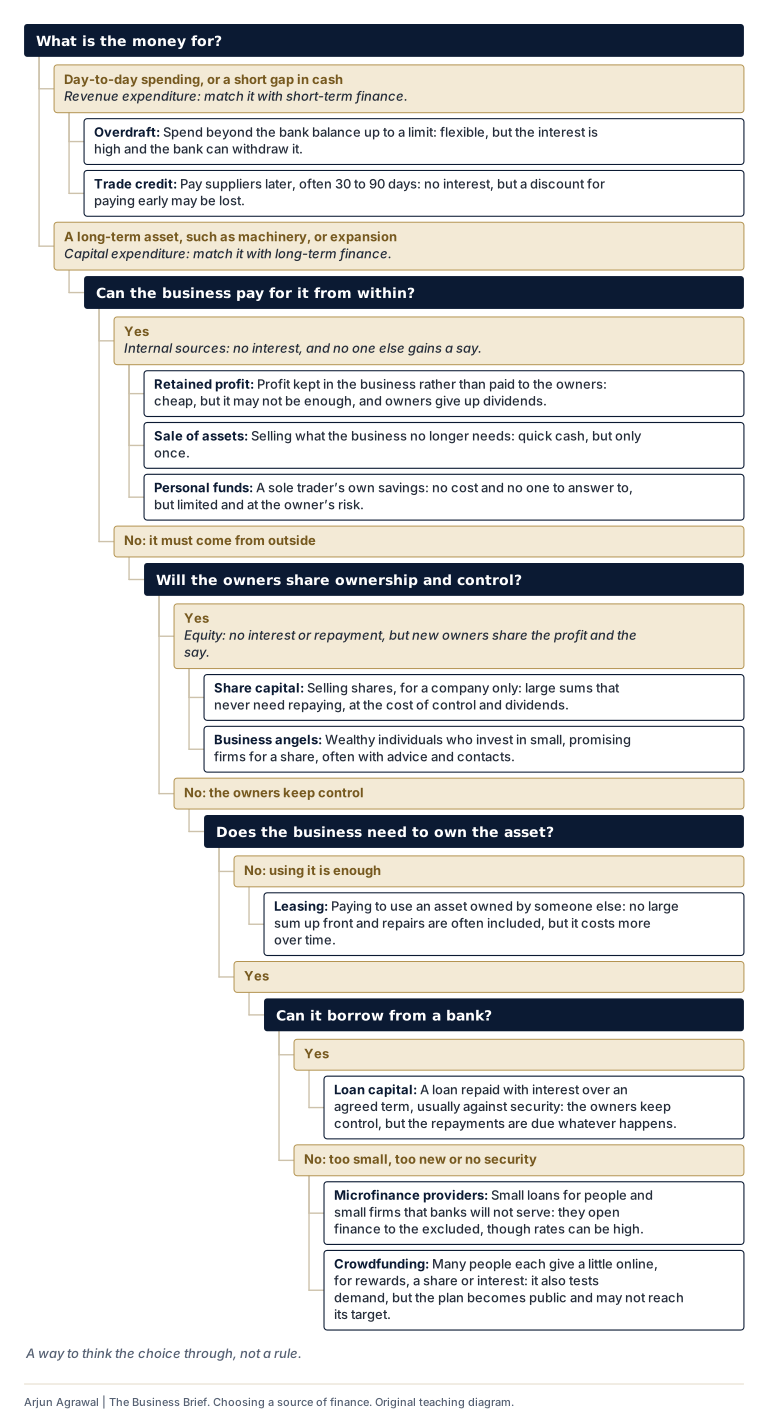
Choosing a source of finance
A decision tree from the purpose of the money to the sources that suit it, with the trade-off of each.
-
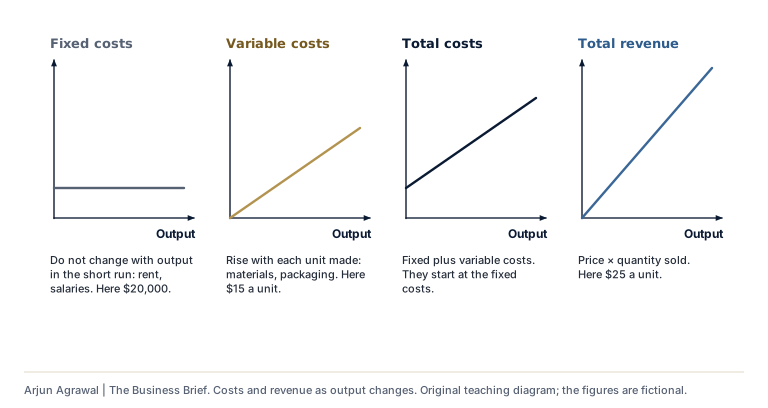
Costs and revenue as output changes
Fixed, variable and total costs, and total revenue.
-
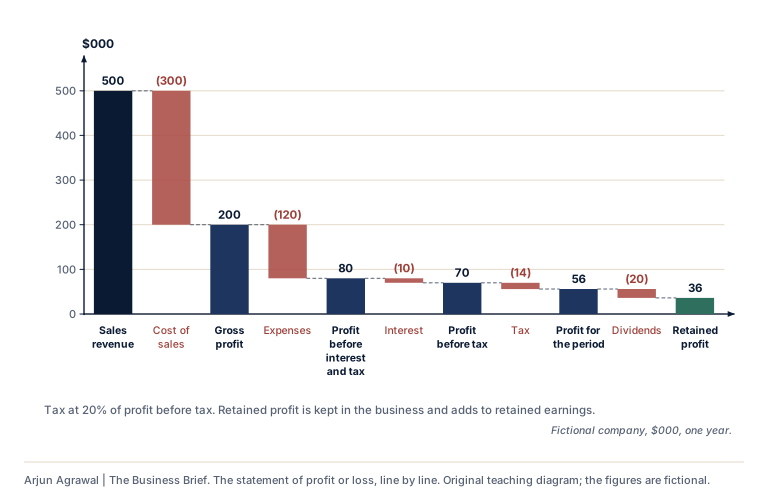
The statement of profit or loss, line by line
From sales revenue to retained profit, in the guide’s order.
-
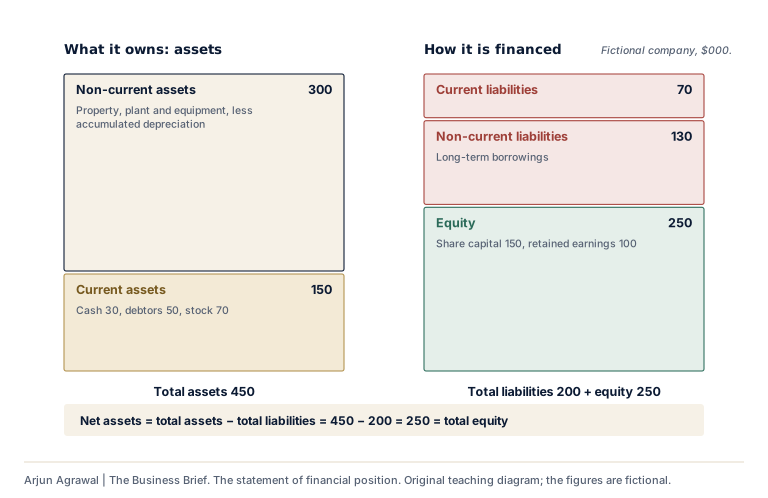
The statement of financial position
What the business owns, and how it is financed, in balance.
-
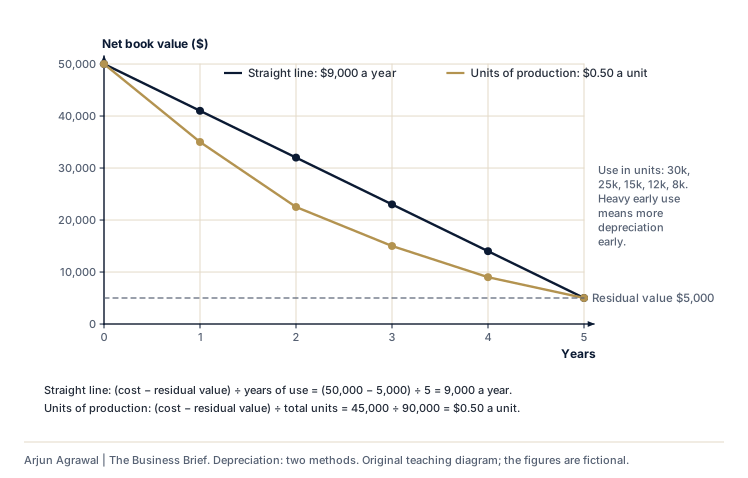
Depreciation: two methods
Straight line and units of production for the same machine.
-
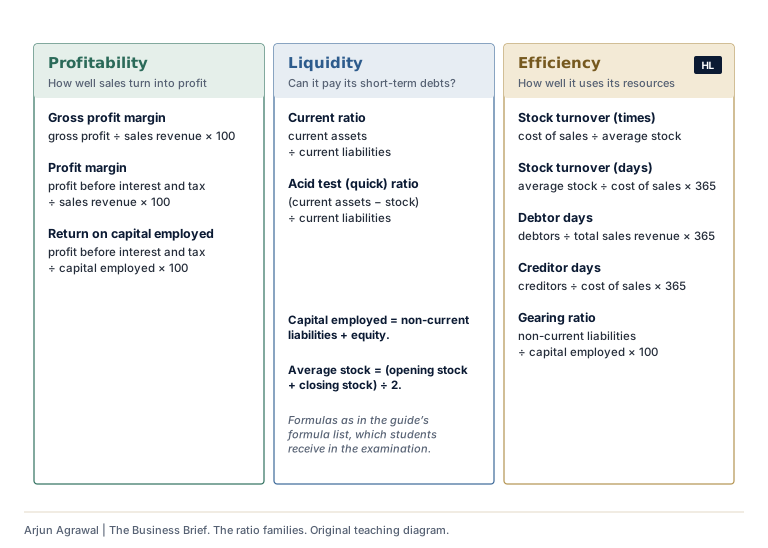
The ratio families
Profitability, liquidity and efficiency ratios with the guide’s formulas.
-
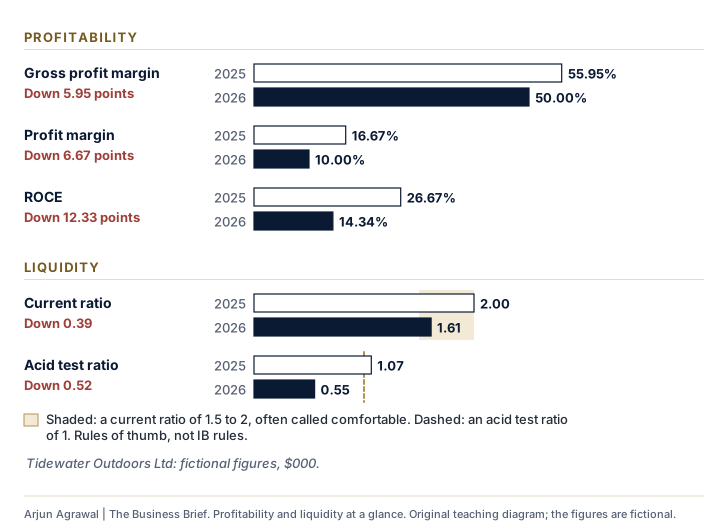
Profitability and liquidity at a glance
Five ratios for a fictional retailer in two years: change the second year’s figures and watch the ratios move.
-
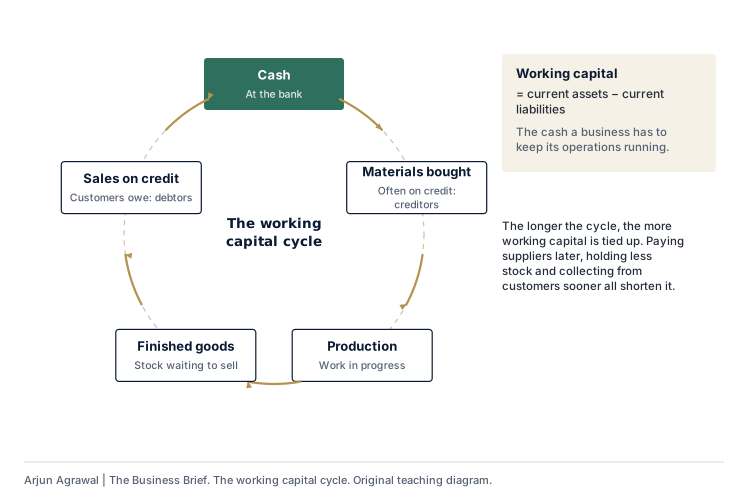
The working capital cycle
From cash to stock to debtors and back to cash.
-
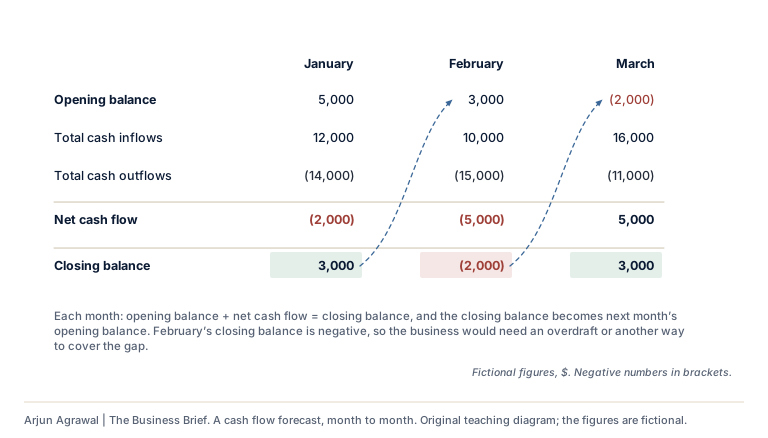
A cash flow forecast, month to month
How each closing balance becomes the next opening balance.
-
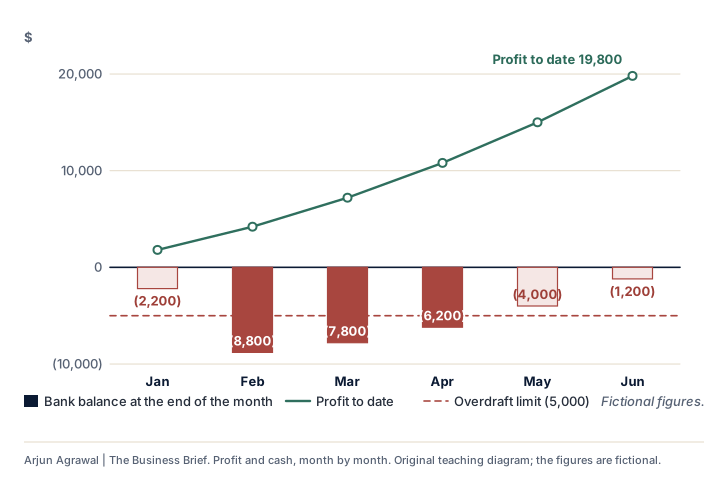
Profit and cash, month by month
A profitable new business can still run out of cash: change the credit terms and see when the money arrives.
-
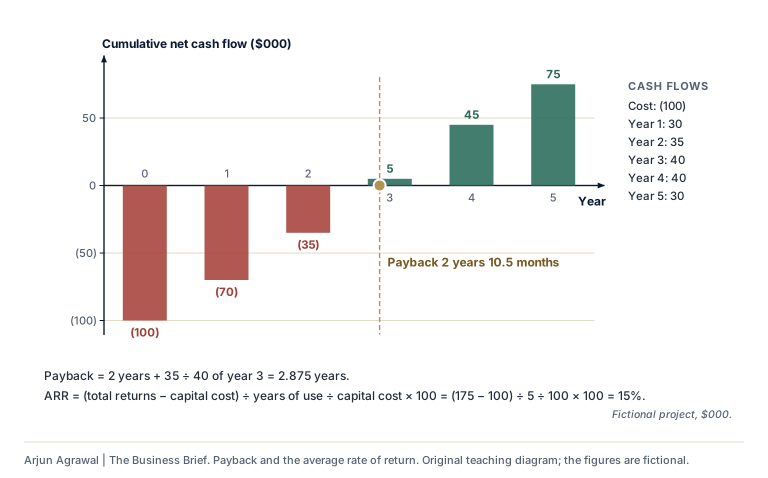
Payback and the average rate of return
Cumulative net cash flow, the payback point and the ARR.
-
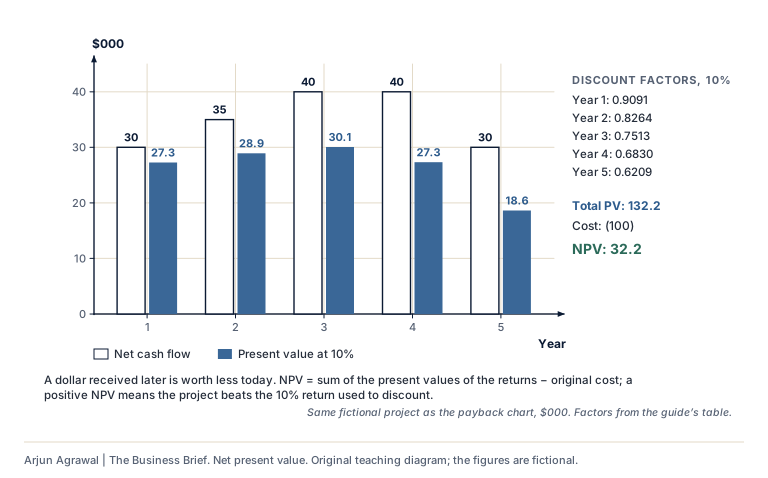
Net present value
Each year’s return discounted to today with the guide’s factors.
-
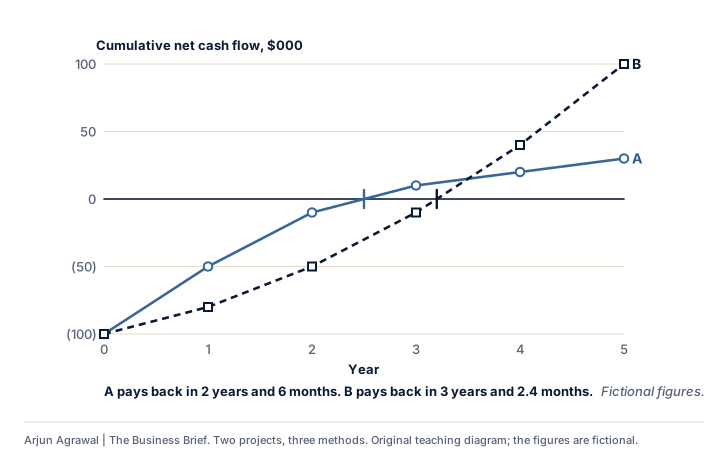
Two projects, three methods
Payback, the average rate of return and NPV (HL) can rank the same two projects differently: change the figures and see when they agree.
-
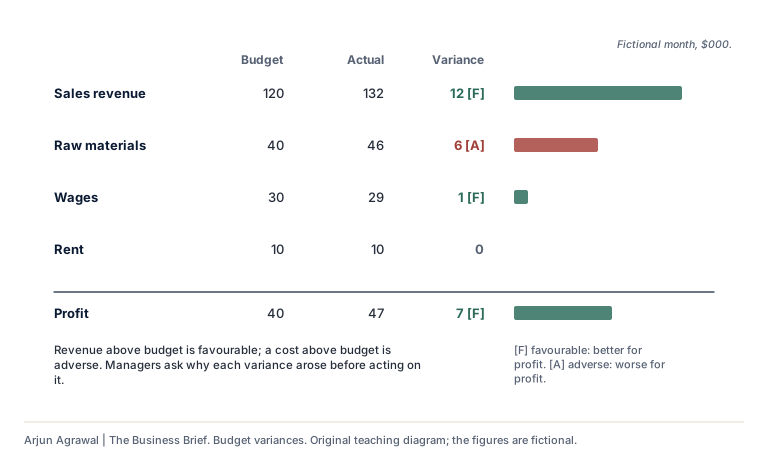
Budget variances
Favourable and adverse variances, judged by their effect on profit.
Section 04: Unit 4: Marketing
-
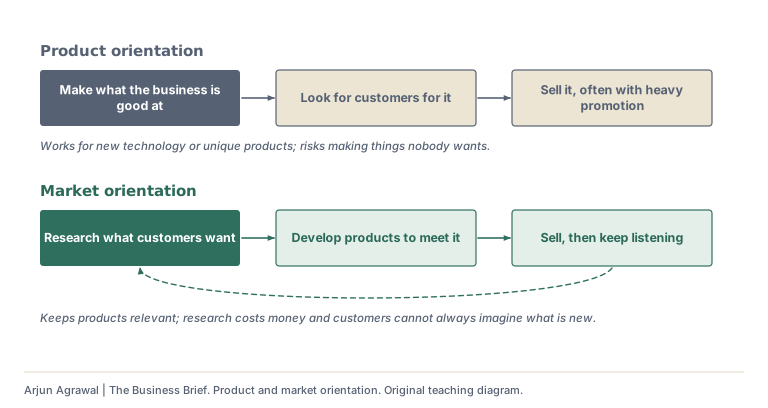
Product and market orientation
Starting from what the business makes, or from what customers want.
-
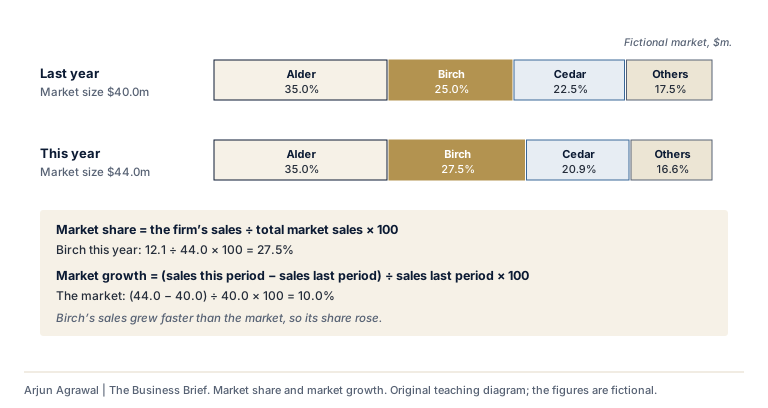
Market share and market growth
Two formulas worked on one fictional market.
-
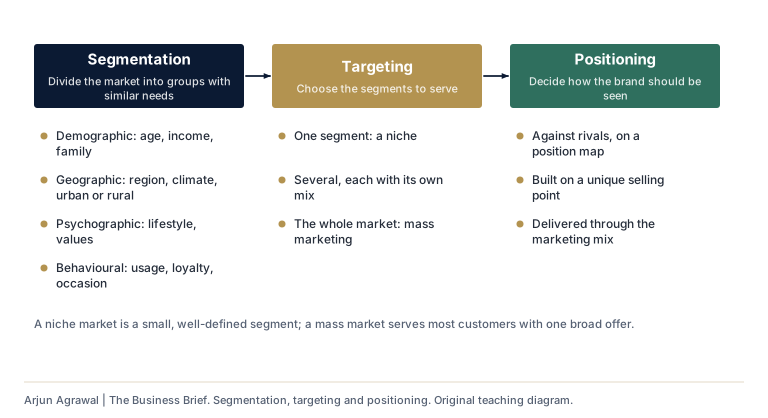
Segmentation, targeting and positioning
The bases of segmentation and the choices that follow.
-
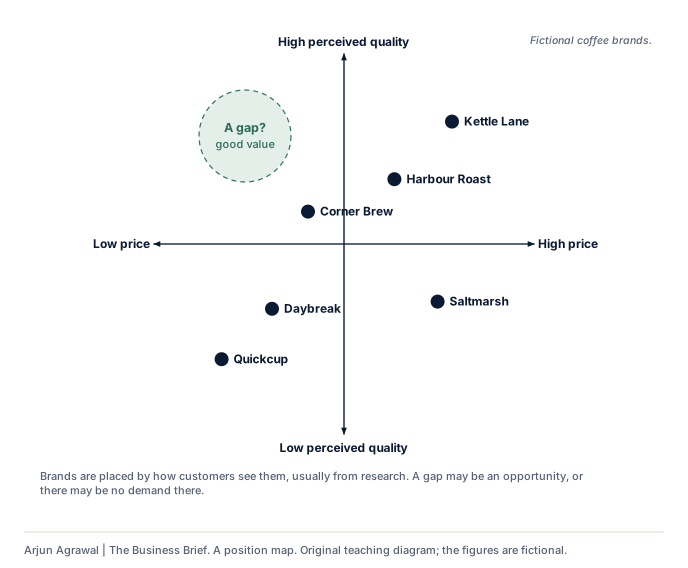
A position map
Brands placed by how customers see them, with a possible gap.
-
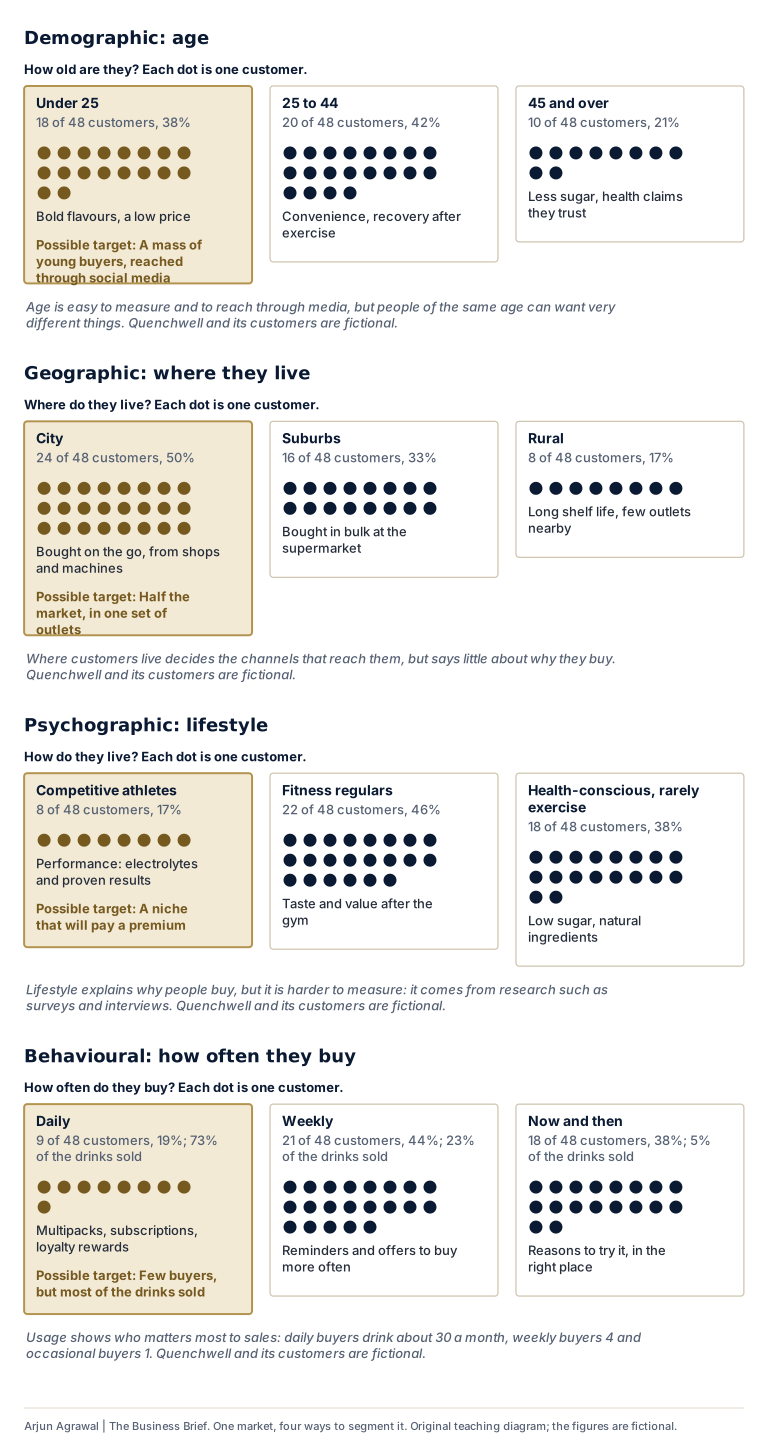
One market, four ways to segment it
The same 48 customers grouped by age, place, lifestyle and how often they buy: each basis suggests a different target.
-
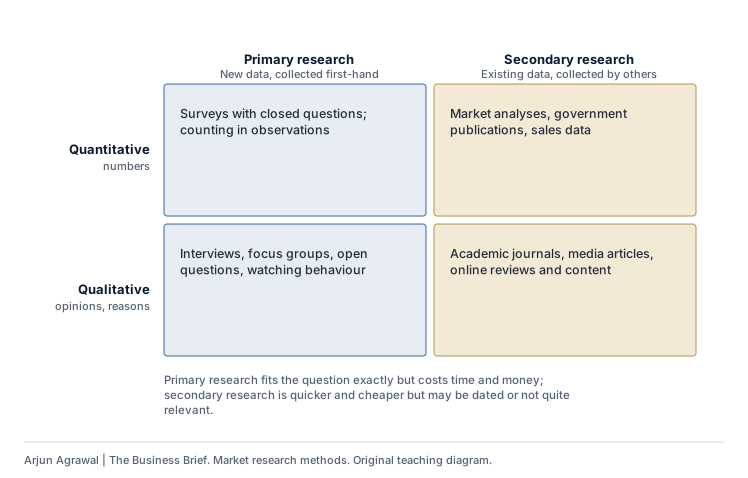
Market research methods
Primary and secondary, quantitative and qualitative.
-
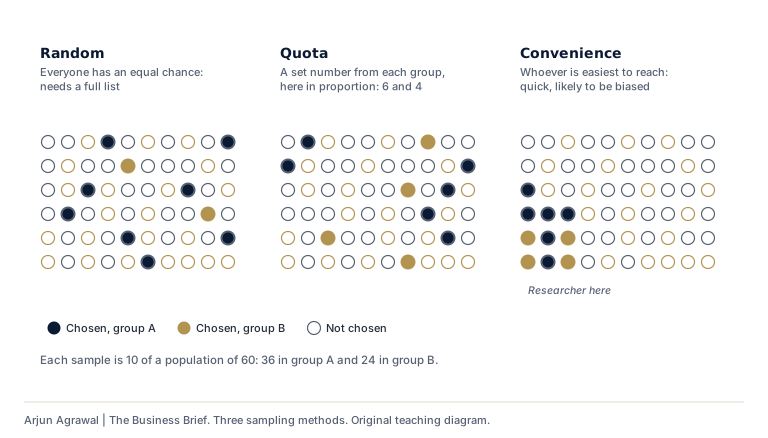
Three sampling methods
Random, quota and convenience samples from one population.
-
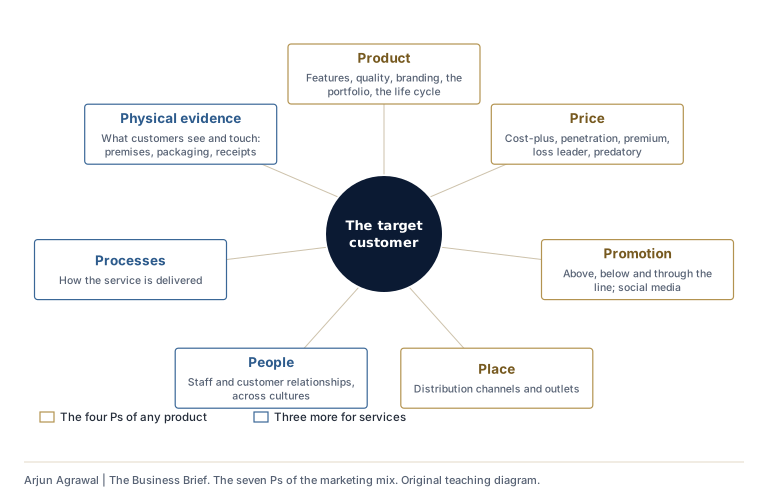
The seven Ps of the marketing mix
The four Ps of any product and three more for services.
-
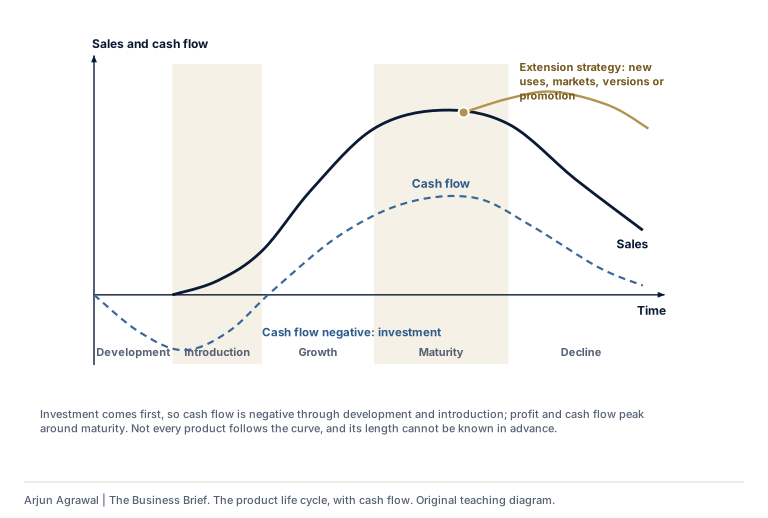
The product life cycle, with cash flow
Five stages, an extension strategy, and why cash flow lags sales.
-
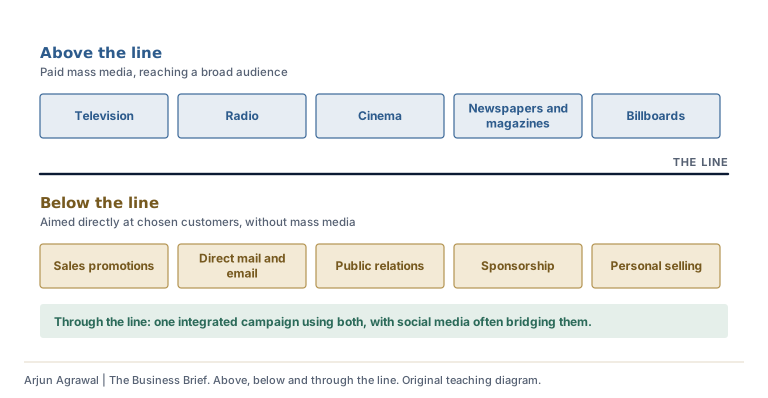
Above, below and through the line
Mass media, targeted promotion, and campaigns that combine them.
-
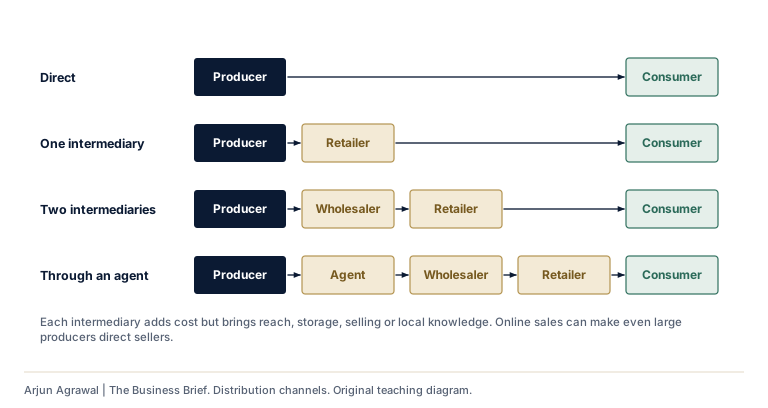
Distribution channels
From direct selling to chains of intermediaries.
-
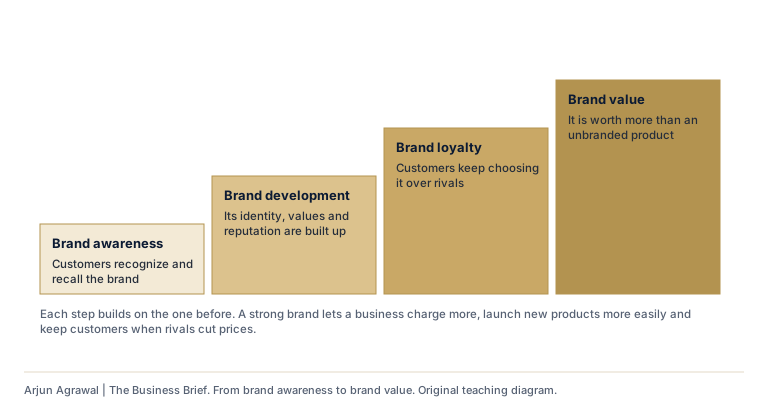
From brand awareness to brand value
The four aspects of branding the guide names.
-
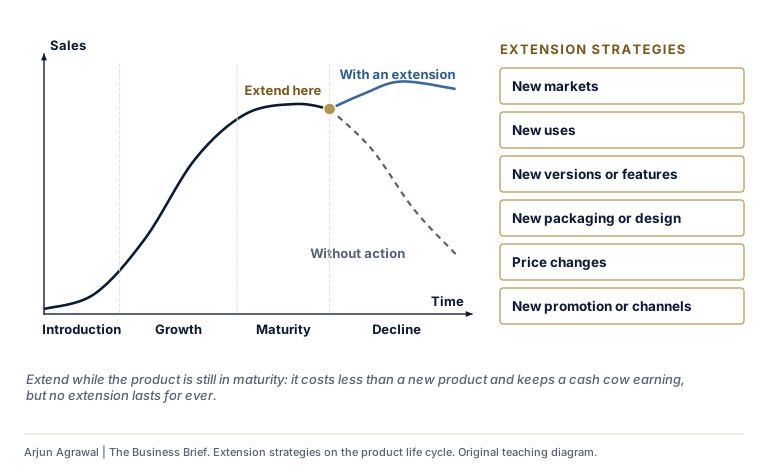
Extension strategies on the product life cycle
Where an extension strategy changes the curve, and the six kinds to choose from.
-
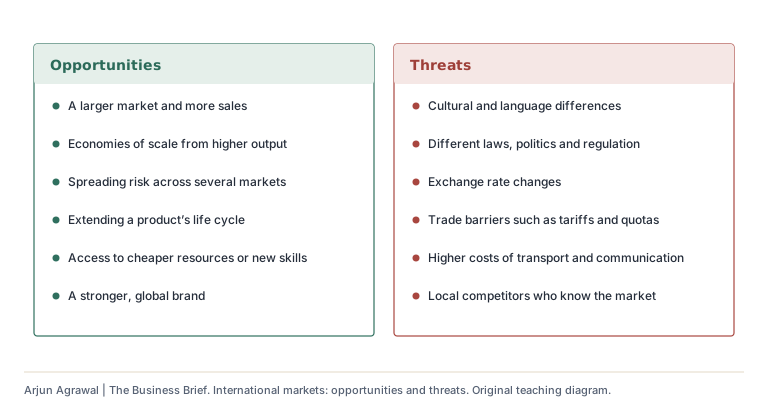
International markets: opportunities and threats
What a business weighs before entering a new country.
Section 05: Unit 5: Operations management
-
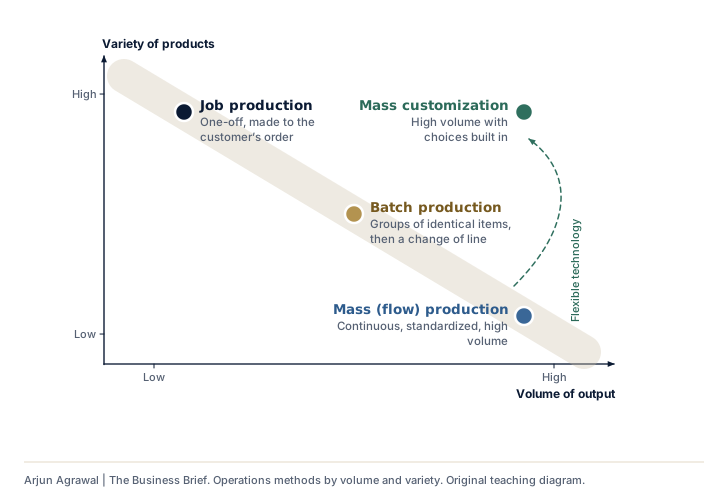
Operations methods by volume and variety
Job, batch and mass production trade variety against volume; mass customization offers both.
-
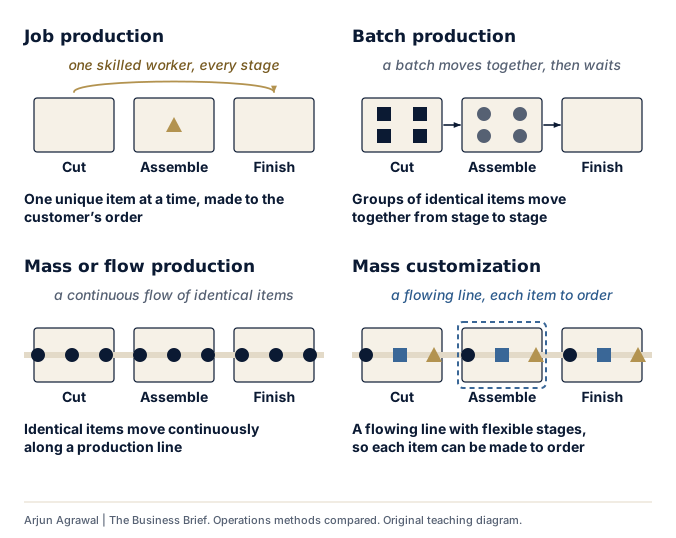
Operations methods compared
How items move through production under each method: choose two to set side by side.
-
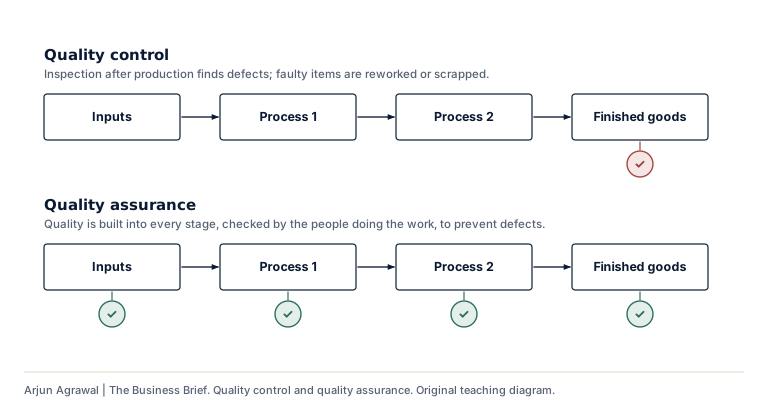
Quality control and quality assurance
Finding defects at the end of the line, or preventing them at every stage.
-
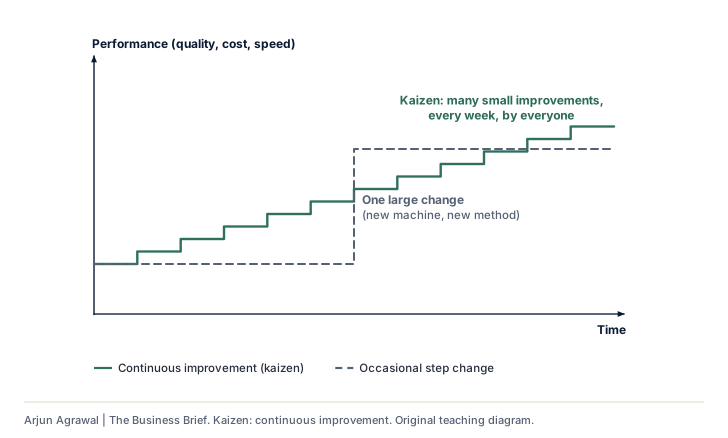
Kaizen: continuous improvement
Many small improvements by everyone, set against one occasional large change.
-
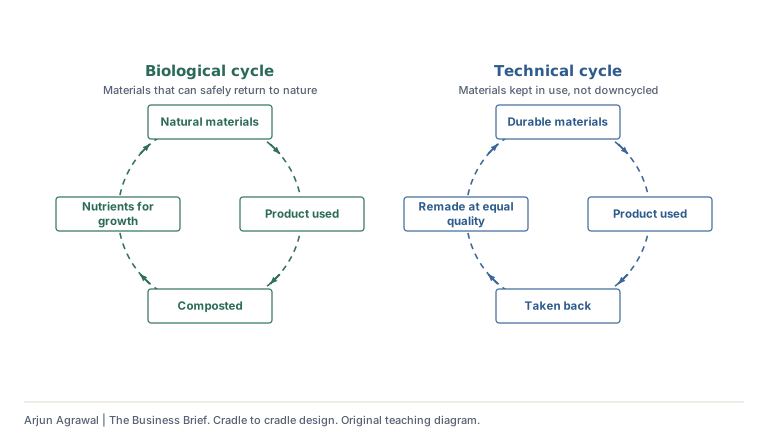
Cradle to cradle design
Every material is designed to return to nature or to be remade at equal quality.
-
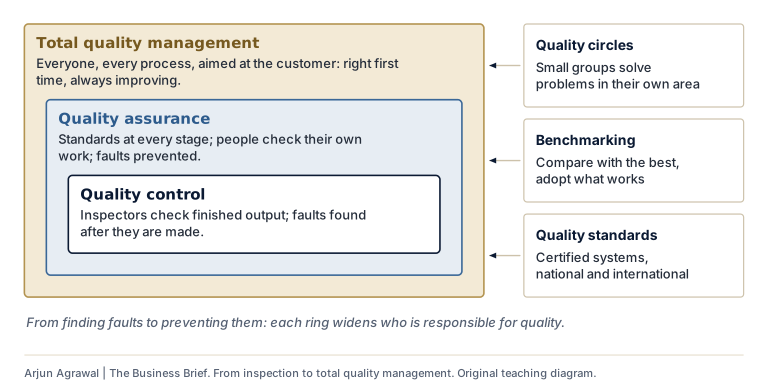
From inspection to total quality management
Quality control, quality assurance and TQM as ever wider rings of responsibility, with the methods that support them.
-
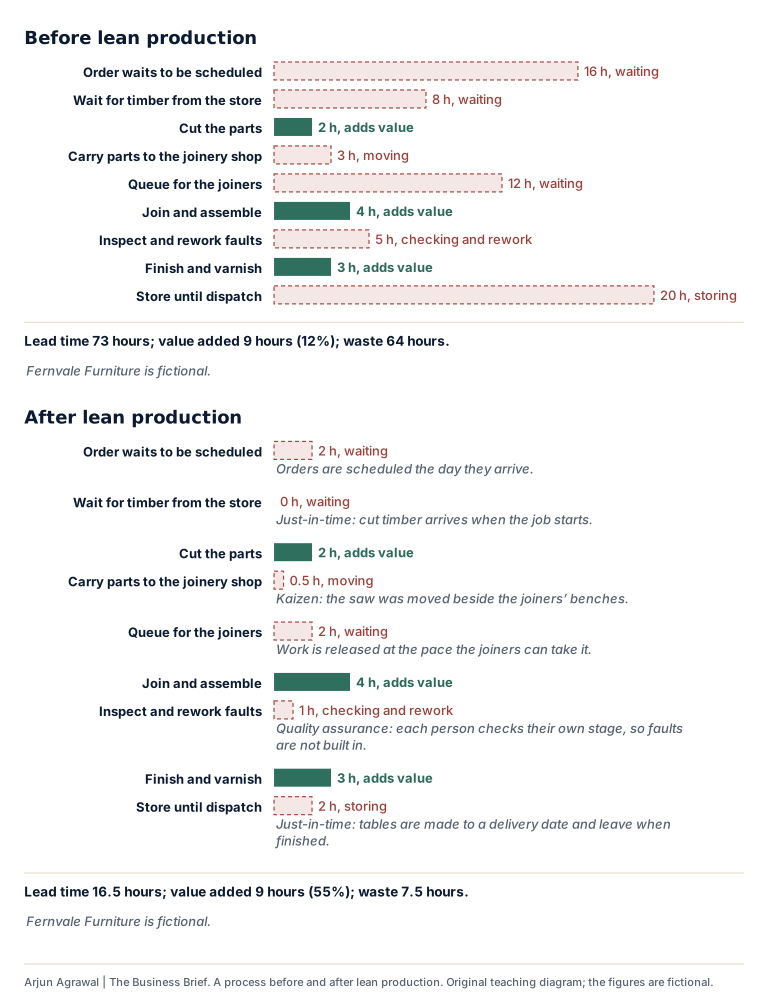
A process before and after lean production
Making one table to order: lean production cuts the waiting, moving, checking and storing, not the work.
-
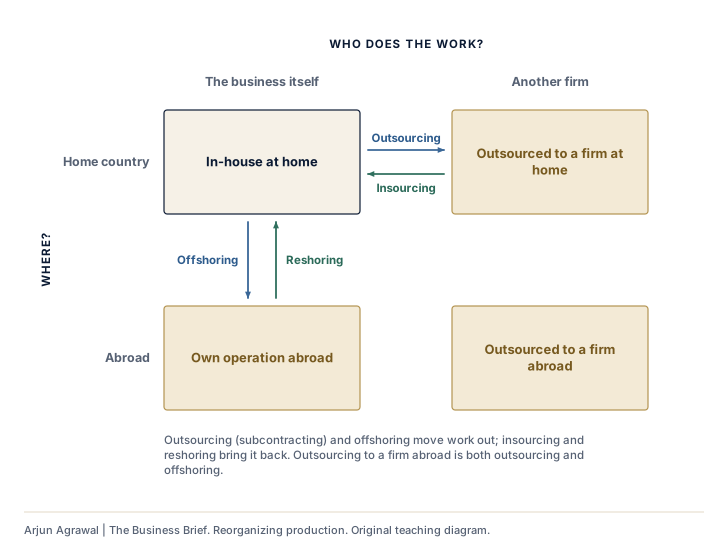
Reorganizing production
Outsourcing, offshoring, insourcing and reshoring as moves between who does the work and where.
-
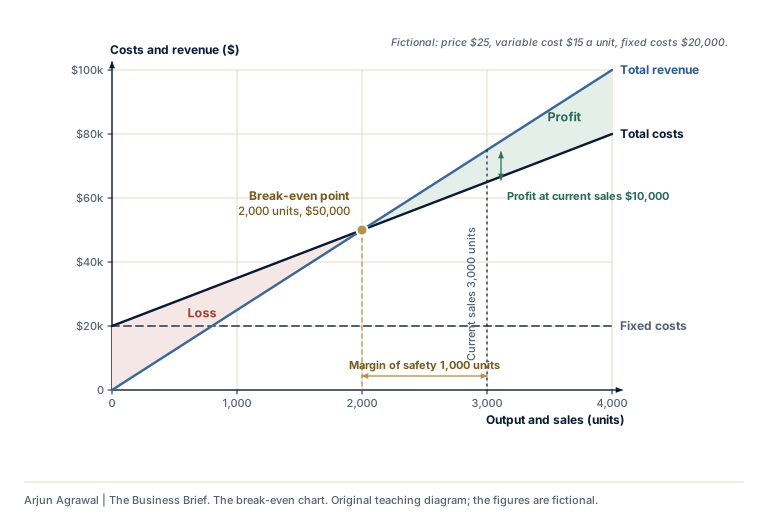
The break-even chart
Where total revenue meets total costs; profit, loss and the margin of safety on either side.
-
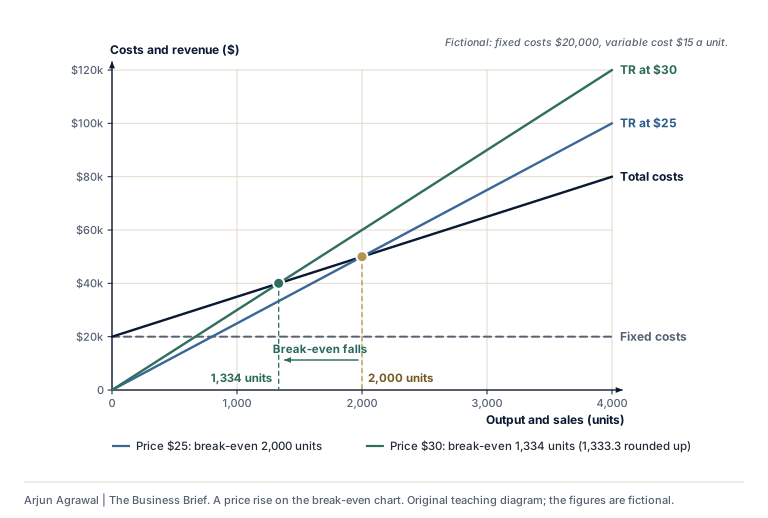
A price rise on the break-even chart
A higher price steepens total revenue and lowers the break-even quantity.
-
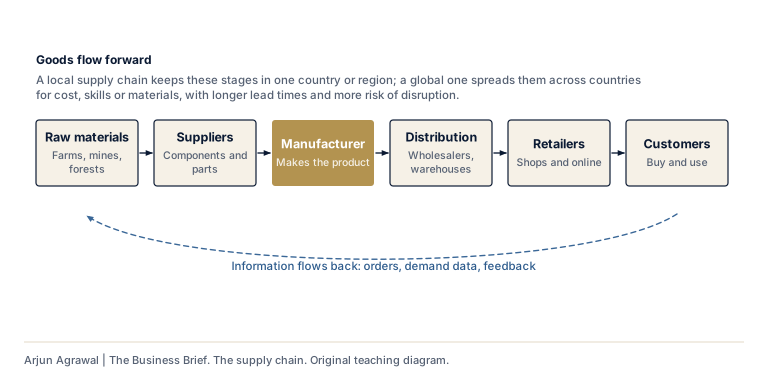
The supply chain
Goods flow forward, information flows back; local or global.
-
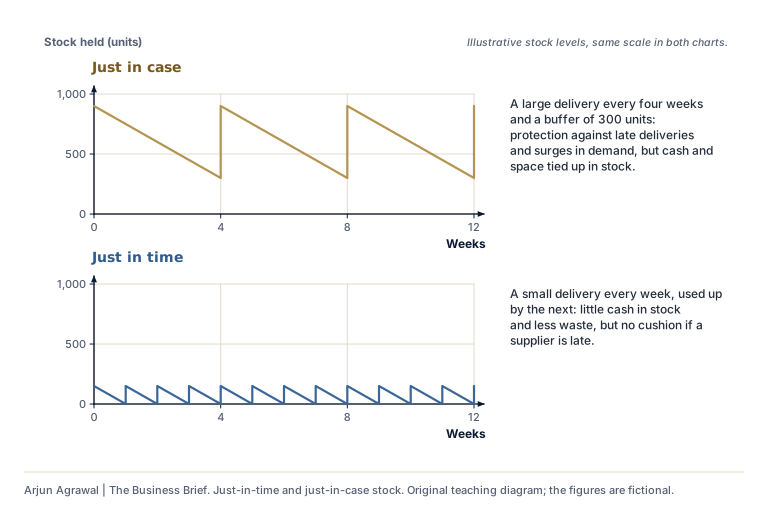
Just-in-time and just-in-case stock
Small frequent deliveries against large deliveries with a buffer.
-
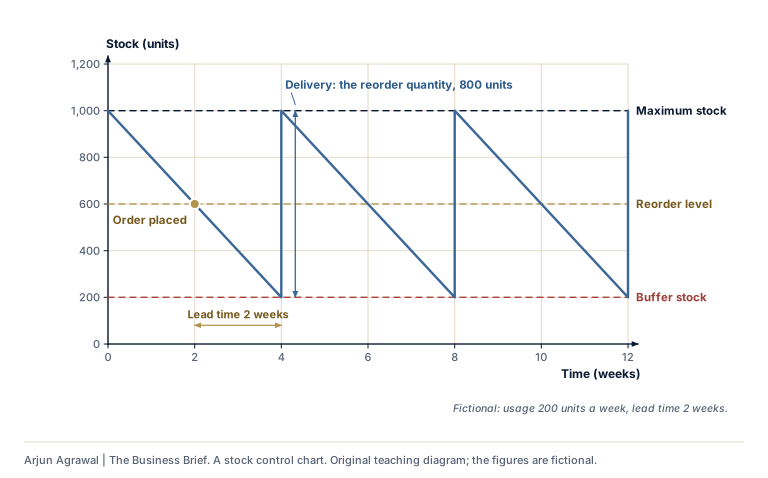
A stock control chart
Buffer stock, reorder level, reorder quantity and lead time on one chart.
-
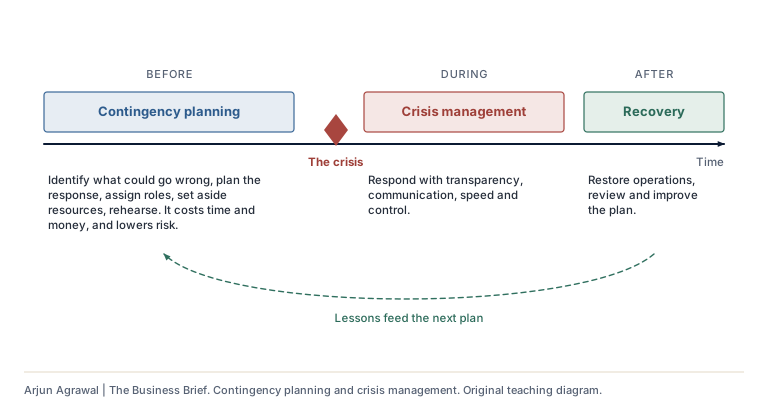
Contingency planning and crisis management
Planning before, managing during, recovering after.
-
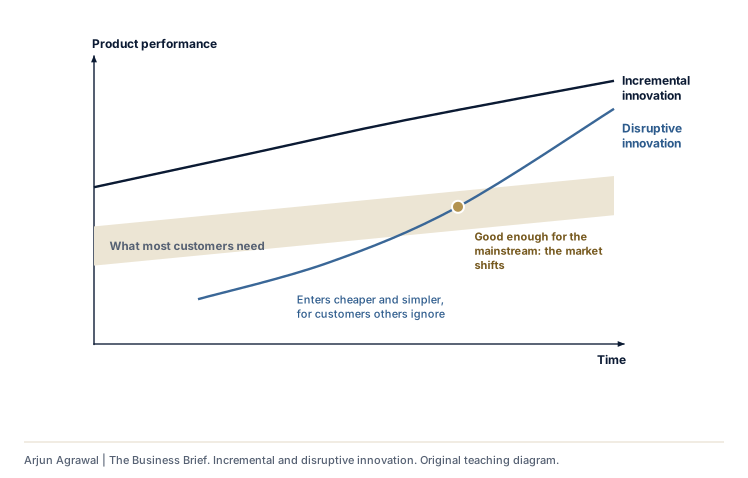
Incremental and disruptive innovation
Improving what exists, or entering from below and overtaking it.
-
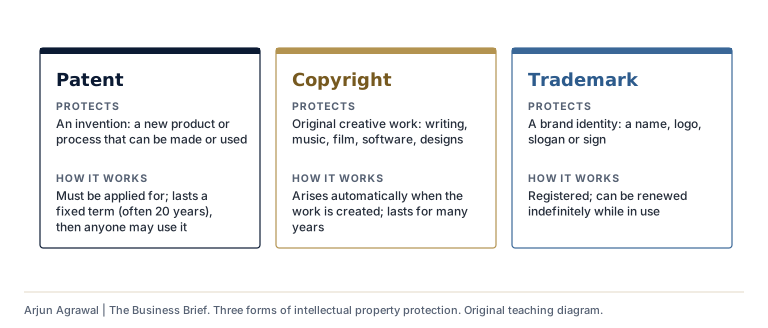
Three forms of intellectual property protection
What patents, copyright and trademarks protect, and how.
-
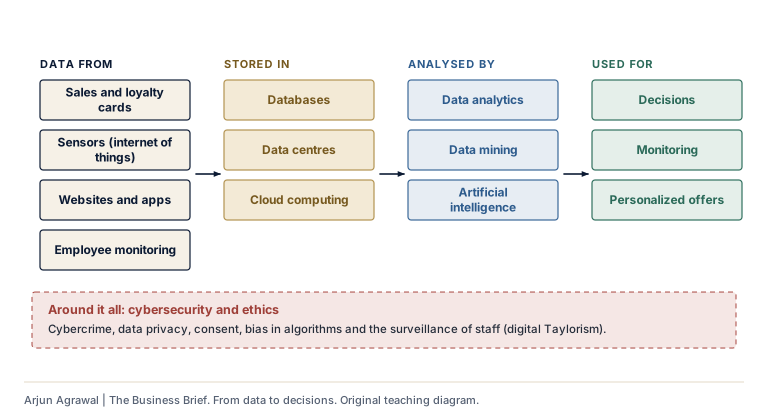
From data to decisions
How a management information system collects, stores, analyses and uses data.
Section 06: The business management toolkit
-
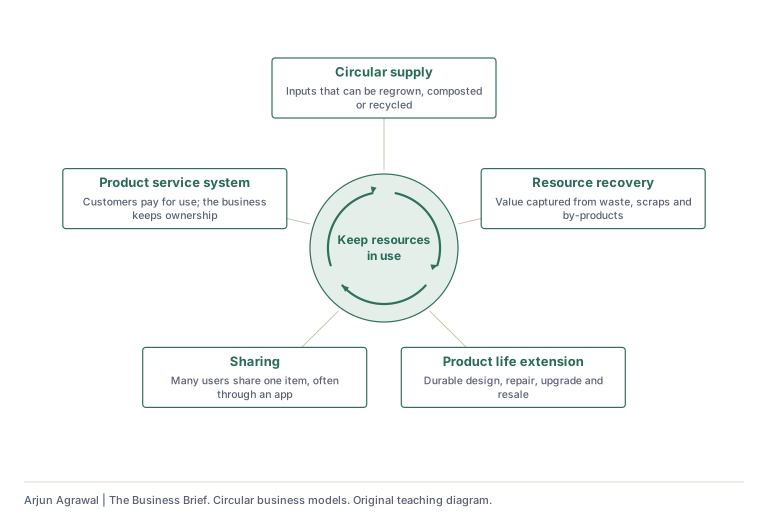
Circular business models
The five models the guide names.
-
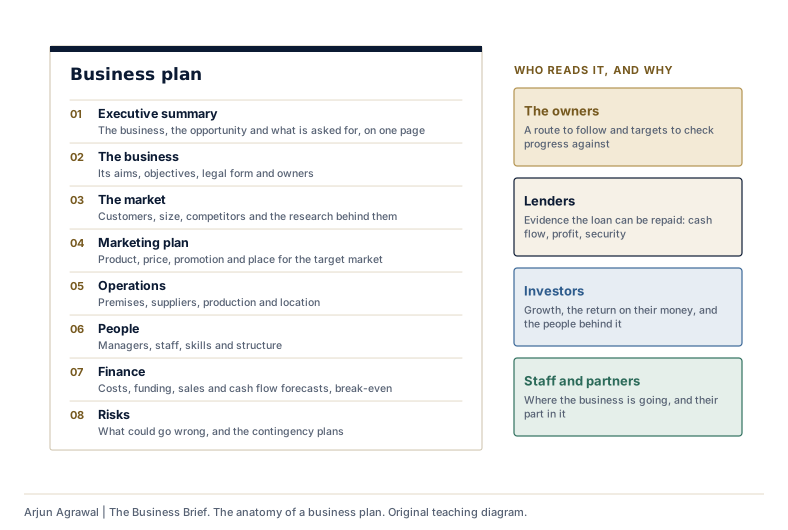
The anatomy of a business plan
Its usual sections, and what each reader looks for.
-
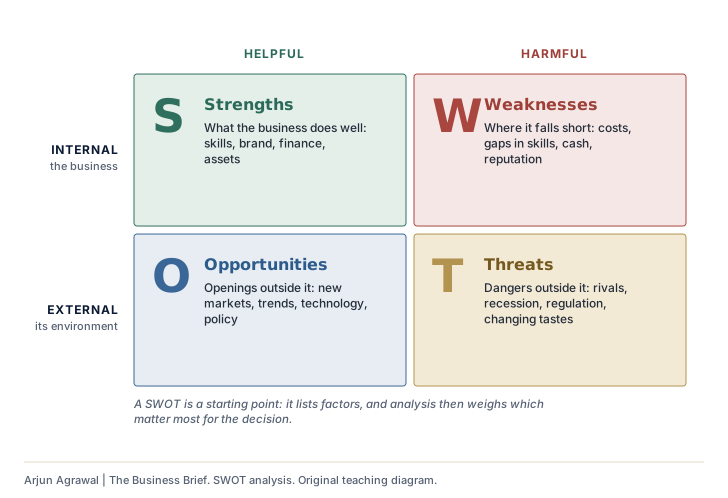
SWOT analysis
Internal strengths and weaknesses, external opportunities and threats.
-
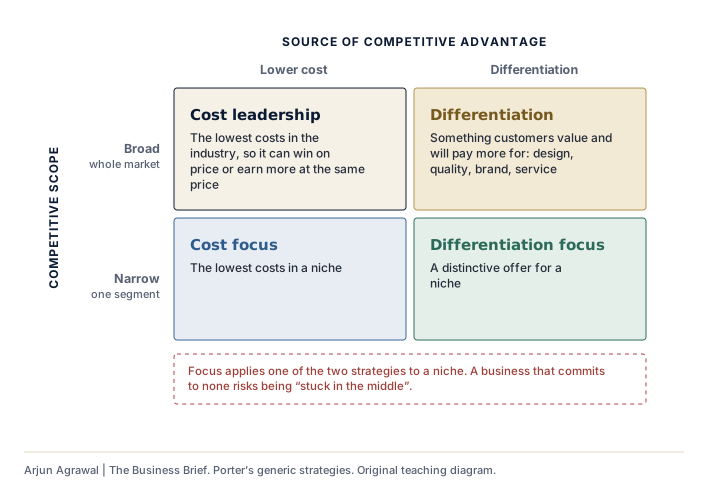
Porter’s generic strategies
Cost leadership, differentiation and focus.
-
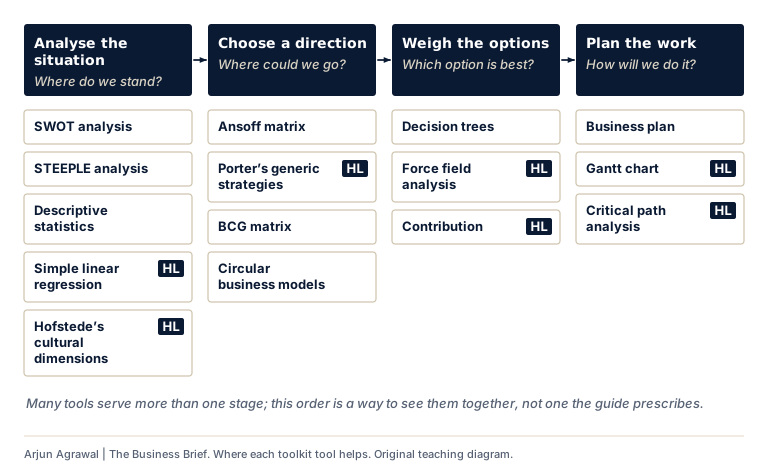
Where each toolkit tool helps
The fifteen toolkit tools placed at the stage of a strategic decision where each helps most; each opens its framework page.
-
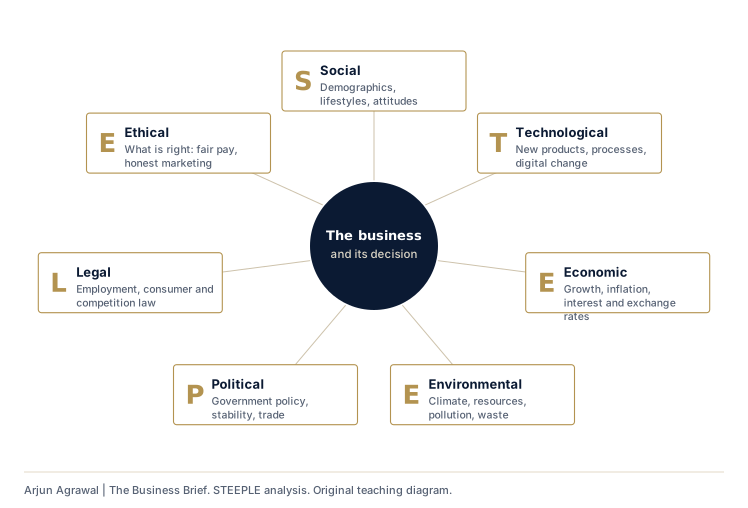
STEEPLE analysis
Seven kinds of external factor that bear on a decision.
-
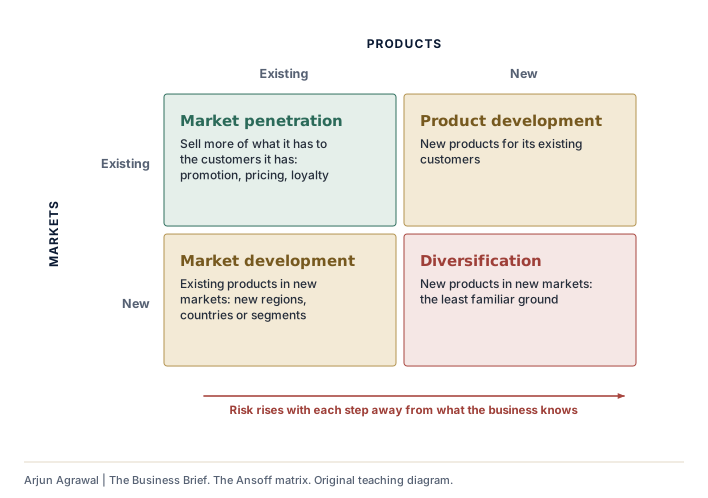
The Ansoff matrix
Four growth strategies, and the risk each carries.
-
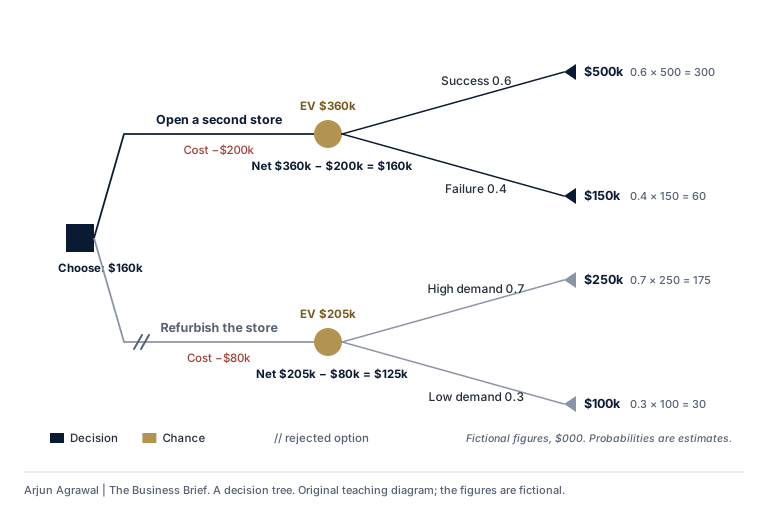
A decision tree
Expected values for two options, with the rejected branch marked.
-
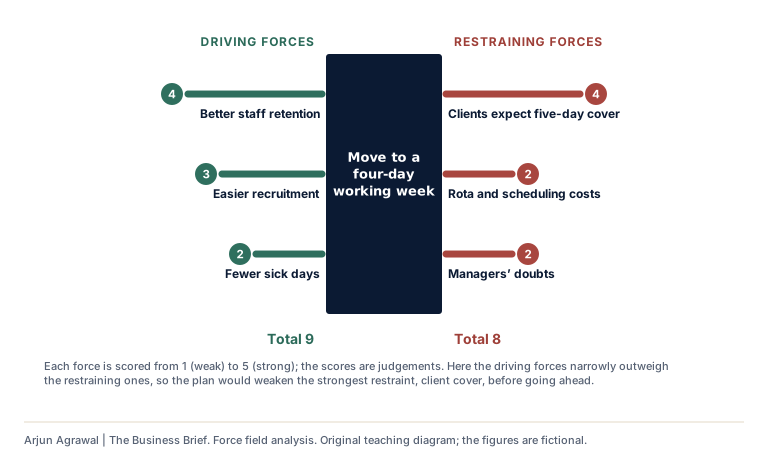
Force field analysis
Driving and restraining forces, scored and weighed.
-
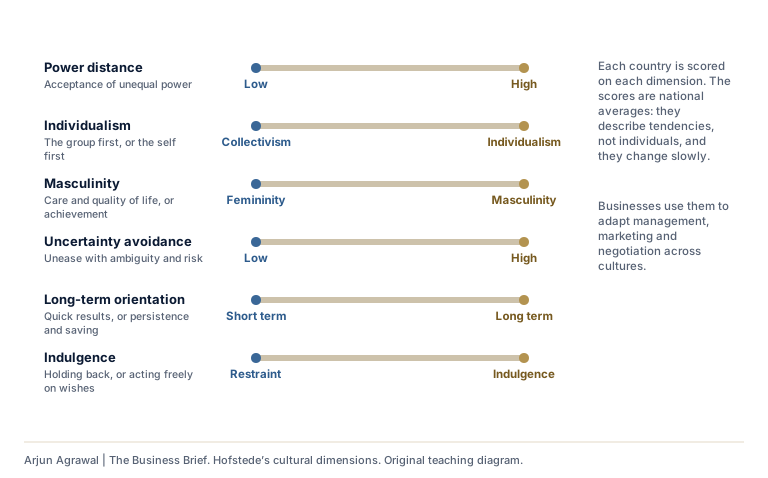
Hofstede’s cultural dimensions
Six scales for comparing national cultures.
-
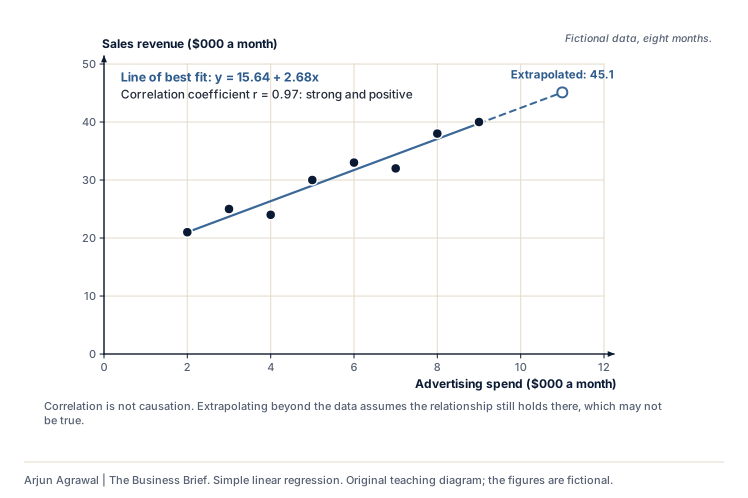
Simple linear regression
A scatter diagram, the line of best fit, correlation and extrapolation.
-
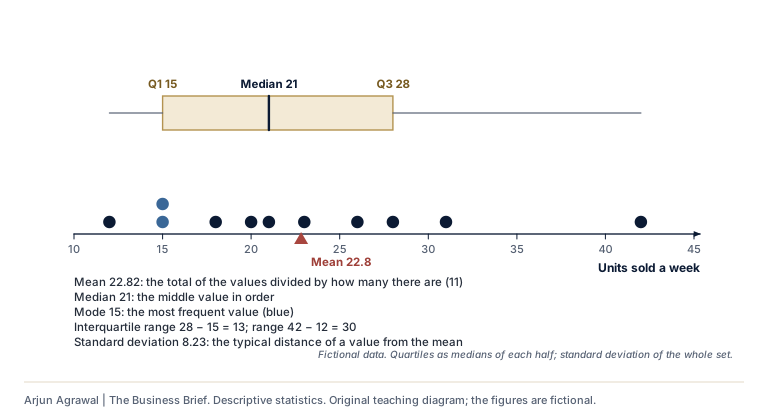
Descriptive statistics
Mean, median, mode, quartiles and standard deviation on one data set.
-
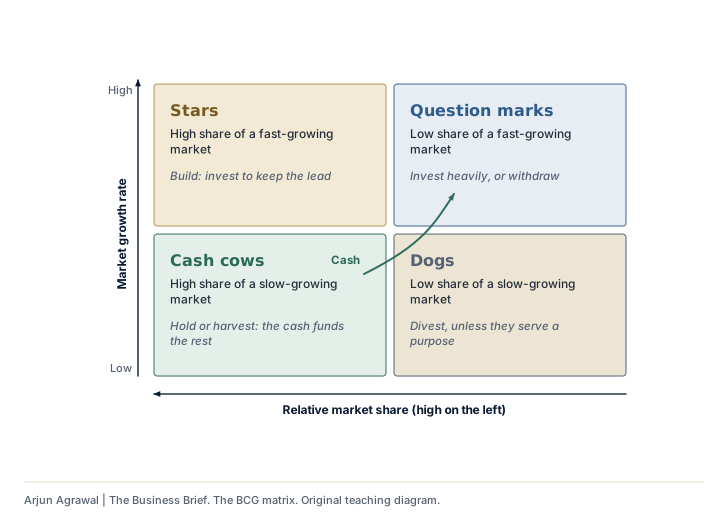
The BCG matrix
A product portfolio by market growth and relative market share.
-
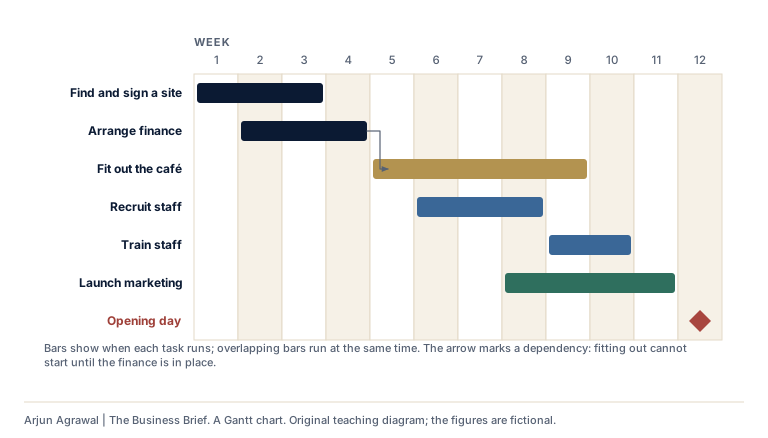
A Gantt chart
Tasks against time, with overlaps, a dependency and a milestone.
-
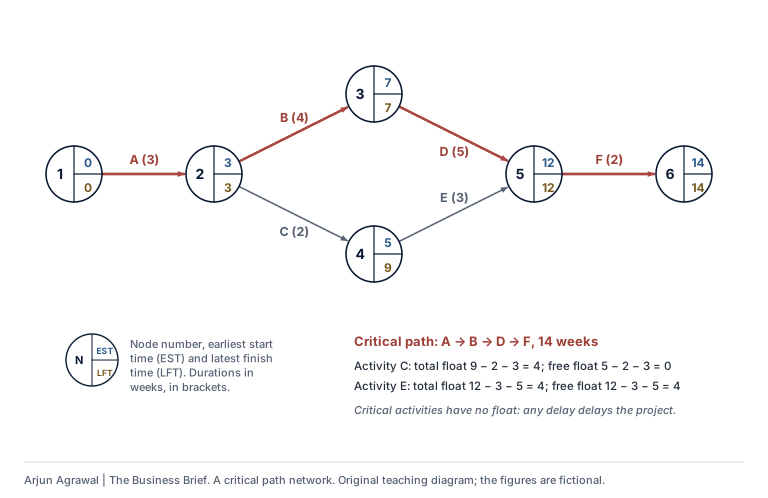
A critical path network
Earliest start and latest finish times, the critical path, total and free float.
Section 07: Enrichment: frameworks beyond the syllabus
-
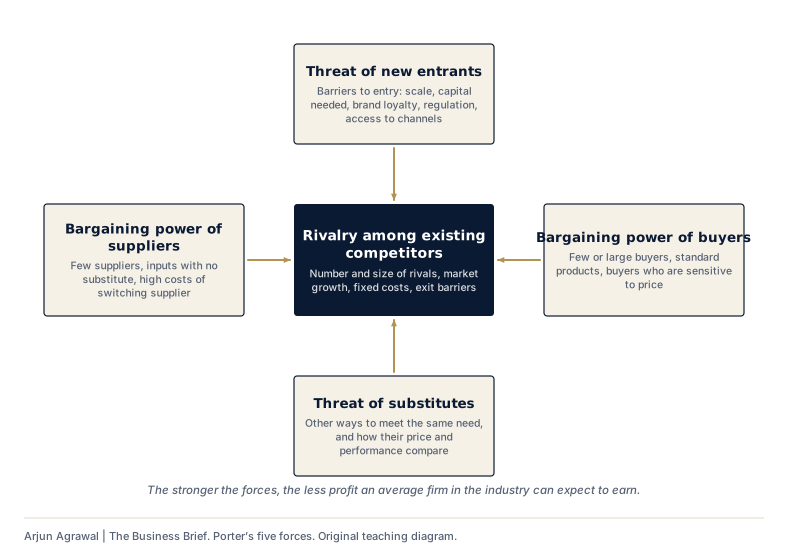
Porter’s five forces
The five forces that shape how profitable an industry can be.
-
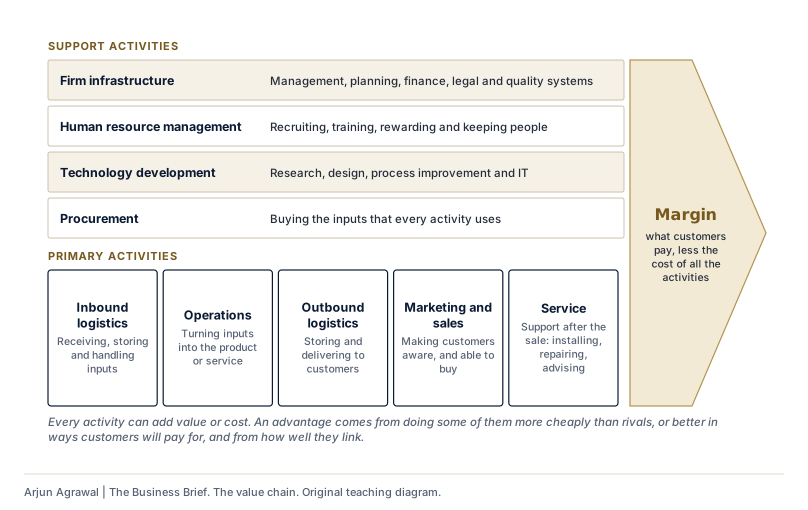
The value chain
Primary and support activities, and the margin they create.
-
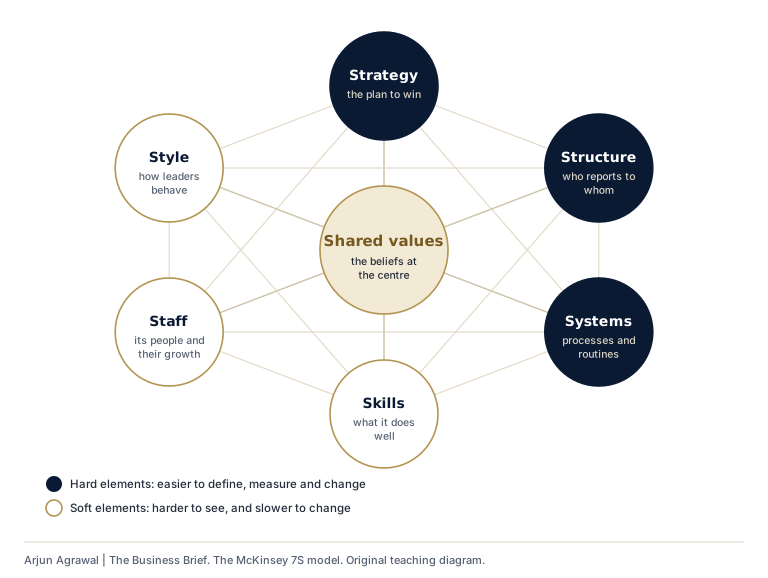
The McKinsey 7S model
Seven elements that must fit together, with shared values at the centre.
-
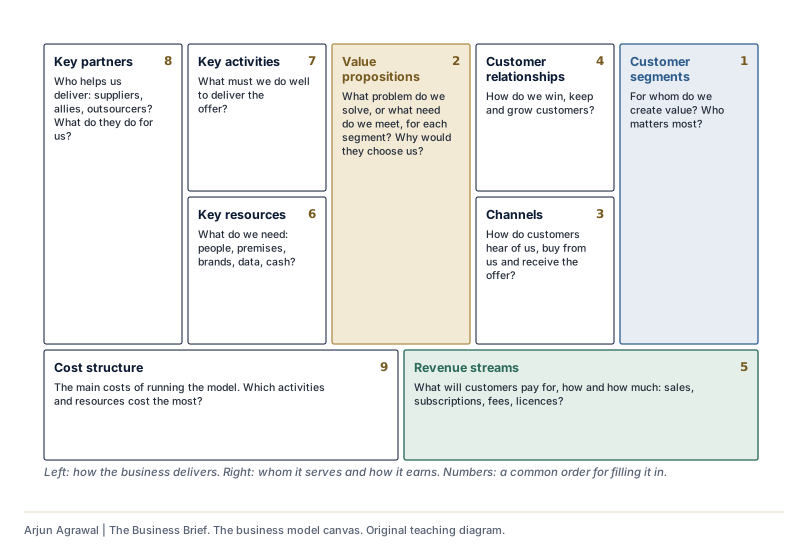
The business model canvas
Nine blocks that describe how a business creates, delivers and captures value.
-
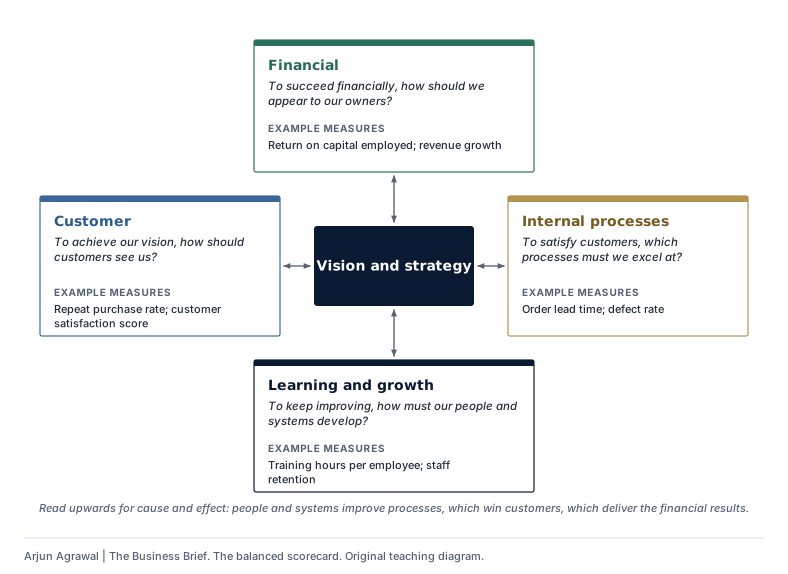
The balanced scorecard
Four perspectives on performance, linked to the strategy.
-
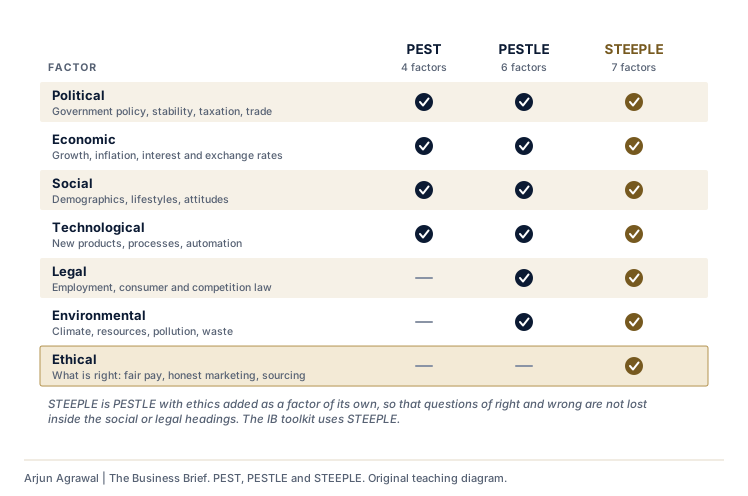
PEST, PESTLE and STEEPLE
Which external factors each framework covers.
-
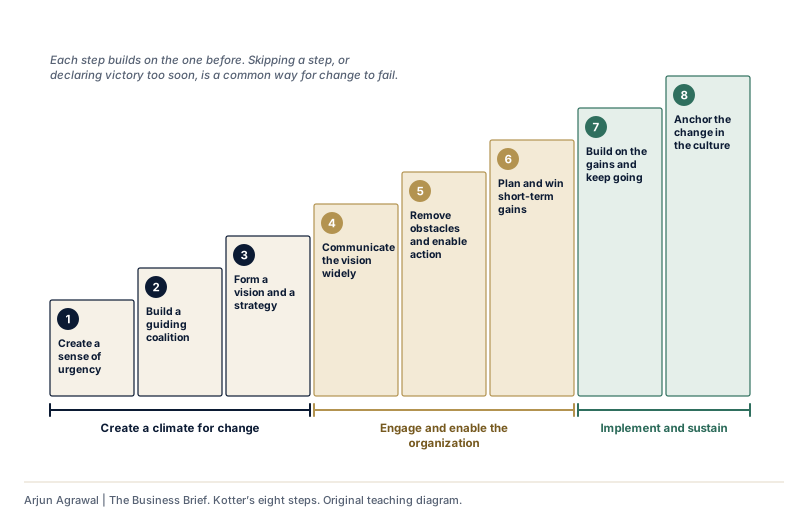
Kotter’s eight steps
A staircase of steps for leading change, in three phases.
-
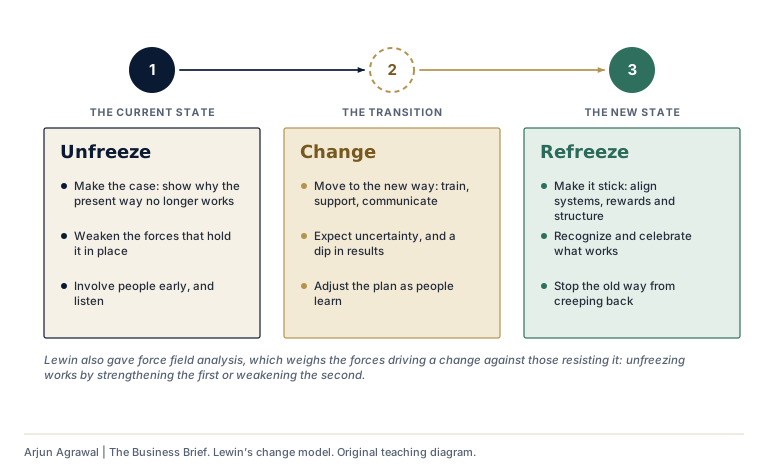
Lewin’s change model
Unfreeze, change, refreeze.
-
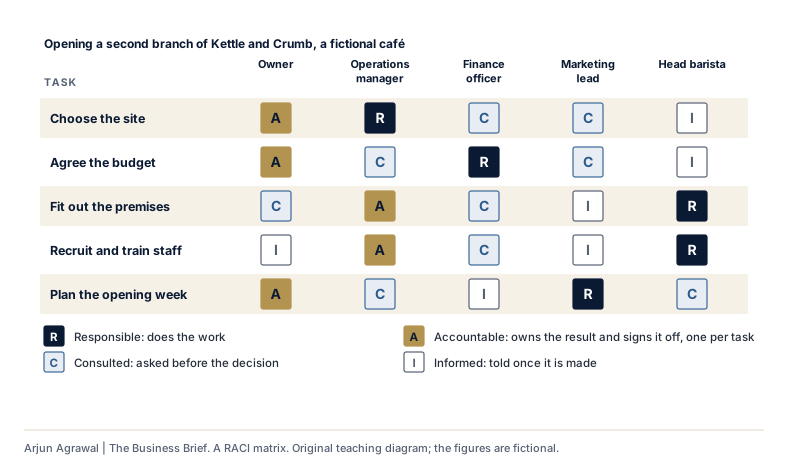
A RACI matrix
Who is responsible, accountable, consulted and informed, task by task.
-
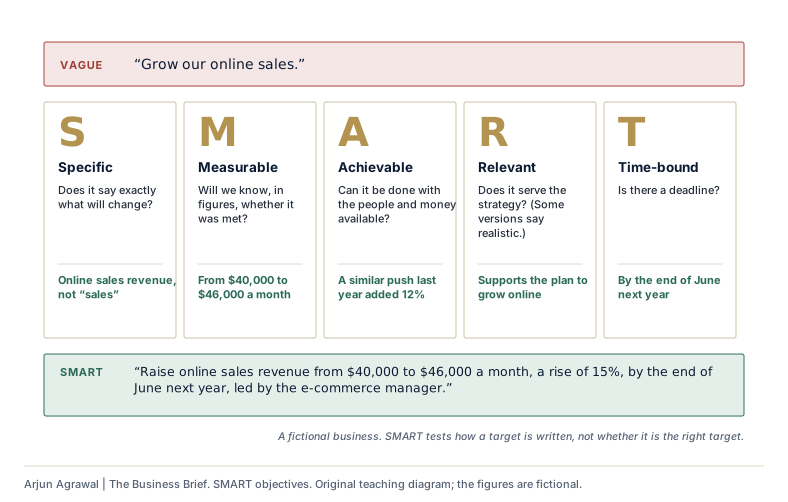
SMART objectives
A vague aim rewritten to pass five tests.
Arjun Agrawal | The Business Brief, https://the-business-brief-dun.vercel.app/diagrams/. Original teaching material, not an IB publication. The organizations in the teaching cases are fictional unless a case says otherwise.