Diagram · The business management toolkit · 4.3

Simple linear regression

HL only Fictional figures
Simple linear regressionA scatter diagram of eight months of fictional data: advertising spend from $2,000 to $9,000 a month against sales revenue from $21,000 to $40,000. The least-squares line of best fit is y = 15.64 + 2.68x, in thousands of dollars, and the correlation coefficient is 0.97, a strong positive correlation. A dashed extension extrapolates to a spend of $11,000, predicting sales of about $45.1k. Correlation is not causation, and extrapolation assumes the relationship holds beyond the data.01020304050024681012Advertising spend ($000 a month)Sales revenue ($000 a month)Extrapolated: 45.1Line of best fit: y = 15.64 + 2.68xCorrelation coefficient r = 0.97: strong and positiveCorrelation is not causation. Extrapolating beyond the data assumes the relationship still holds there, which may notbe true.Fictional data, eight months.
Simple linear regressionA scatter diagram of eight months of fictional data: advertising spend from $2,000 to $9,000 a month against sales revenue from $21,000 to $40,000. The least-squares line of best fit is y = 15.64 + 2.68x, in thousands of dollars, and the correlation coefficient is 0.97, a strong positive correlation. A dashed extension extrapolates to a spend of $11,000, predicting sales of about $45.1k. Correlation is not causation, and extrapolation assumes the relationship holds beyond the data.0255004812Sales revenue, $000 a monthAdvertising, $000 a monthLine of best fit: y = 15.64 + 2.68xr = 0.97: a strong positivecorrelationExtrapolated to 11: about 45.1 (theopen circle)Correlation is not causation, andextrapolating assumes the patternholds beyond the data. Fictional data.

Simple linear regression HL A scatter diagram, the line of best fit, correlation and extrapolation.
Text description

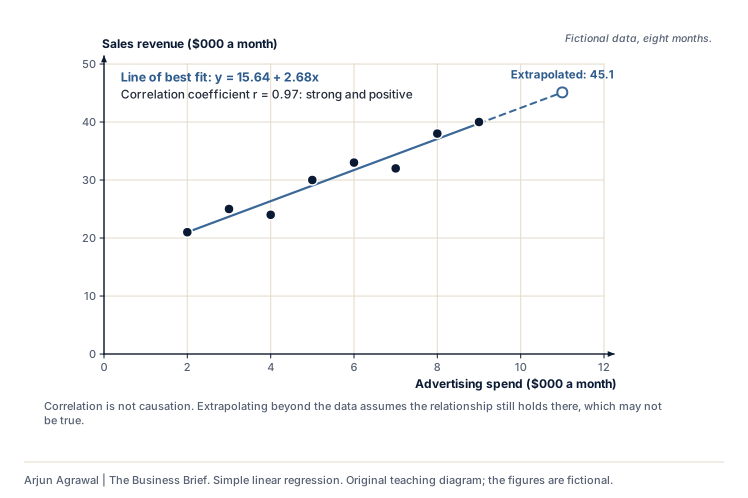
A scatter diagram of eight months of fictional data: advertising spend from $2,000 to $9,000 a month against sales revenue from $21,000 to $40,000. The least-squares line of best fit is y = 15.64 + 2.68x, in thousands of dollars, and the correlation coefficient is 0.97, a strong positive correlation. A dashed extension extrapolates to a spend of $11,000, predicting sales of about $45.1k. Correlation is not causation, and extrapolation assumes the relationship holds beyond the data.

Download SVG

Section 01: Where it is used