Diagram · The business management toolkit · 4.4, 2.4

Descriptive statistics

SL and HL Fictional figures
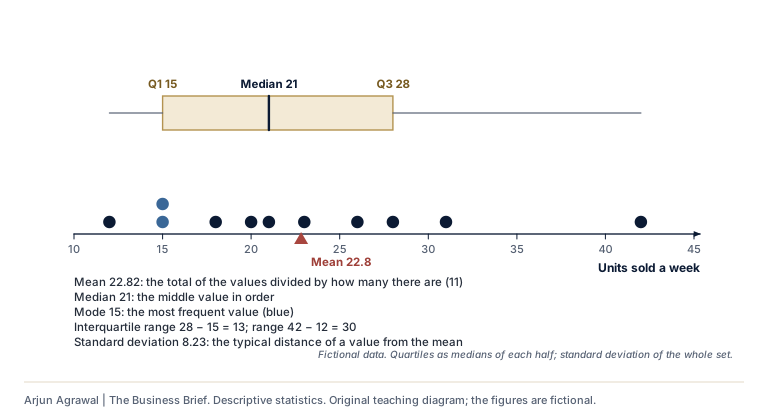
Descriptive statistics on one data setA dot plot of 11 weeks of fictional sales: 12, 15, 15, 18, 20, 21, 23, 26, 28, 31, 42 units. Above it, a box runs from the lower quartile, 15, to the upper quartile, 28, with the median, 21, marked inside. The mean is 22.82, pulled above the median by the one high week of 42. The mode is 15. The interquartile range is 13, the range is 30, and the standard deviation is 8.23. Quartiles here are the medians of the lower and upper halves; other methods give slightly different values.1015202530354045Units sold a weekQ1 15Median 21Q3 28Mean 22.8Mean 22.82: the total of the values divided by how many there are (11)Median 21: the middle value in orderMode 15: the most frequent value (blue)Interquartile range 28 − 15 = 13; range 42 − 12 = 30Standard deviation 8.23: the typical distance of a value from the meanFictional data. Quartiles as medians of each half; standard deviation of the whole set.
Descriptive statistics on one data setA dot plot of 11 weeks of fictional sales: 12, 15, 15, 18, 20, 21, 23, 26, 28, 31, 42 units. Above it, a box runs from the lower quartile, 15, to the upper quartile, 28, with the median, 21, marked inside. The mean is 22.82, pulled above the median by the one high week of 42. The mode is 15. The interquartile range is 13, the range is 30, and the standard deviation is 8.23. Quartiles here are the medians of the lower and upper halves; other methods give slightly different values.10203040Units sold a weekBox: lower quartile 15 to upperquartile 28, median 21 (the lineinside)Mean 22.82 (the red marker): the totaldivided by 11Mode 15: the most frequent value (bluedots)Interquartile range 28 − 15 = 13;range 42 − 12 = 30Standard deviation 8.23: the typicaldistance from the meanFictional data. Quartiles as mediansof each half.

Descriptive statistics Mean, median, mode, quartiles and standard deviation on one data set.
Text description

A dot plot of 11 weeks of fictional sales: 12, 15, 15, 18, 20, 21, 23, 26, 28, 31, 42 units. Above it, a box runs from the lower quartile, 15, to the upper quartile, 28, with the median, 21, marked inside. The mean is 22.82, pulled above the median by the one high week of 42. The mode is 15. The interquartile range is 13, the range is 30, and the standard deviation is 8.23. Quartiles here are the medians of the lower and upper halves; other methods give slightly different values.

Download SVG

Section 01: Where it is used