Diagram · Unit 3 · 3.8
Two projects, three methods
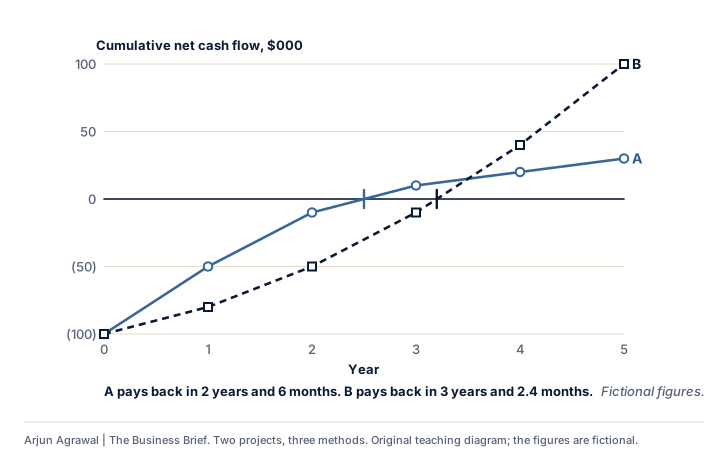
Change either project’s cost or yearly returns, or the discount rate; the chart and the table follow.
| Method | Project A | Project B | Prefers |
|---|---|---|---|
| Payback period | 2 years and 6 months | 3 years and 2.4 months | A |
| Average rate of return | 6.00% | 20.00% | B |
| NPV at 10% (HL) | $6.58k | $44.43k | B |
The methods disagree. Payback prefers A; the ARR and NPV prefer B. Payback rewards getting the money back soon; the ARR and NPV count every year's return, and NPV also counts when it arrives. The choice depends on what the business needs most: cash back quickly, or the larger return.
The figures above are the example’s. With JavaScript on, they can be changed here.
Text description
Two fictional projects. A, a delivery van, costs $100k and its cumulative net cash flow runs (100), (50), (10), 10, 20, 30; it pays back in 2 years and 6 months. B, an online shop, costs $100k and its cumulative net cash flow runs (100), (80), (50), (10), 40, 100; it pays back in 3 years and 2.4 months. Each line crosses zero where the project has repaid its cost.
Section 01: Where it is used
- 3.8 Investment appraisal On the subtopic’s page, with its other diagrams
Arjun Agrawal | The Business Brief, https://the-business-brief-dun.vercel.app/diagrams/investment-compare/. Original teaching material, not an IB publication. The organizations in the teaching cases are fictional unless a case says otherwise.