Diagram · Unit 3 · 3.3, 5.5
Costs and revenue as output changes
Text description
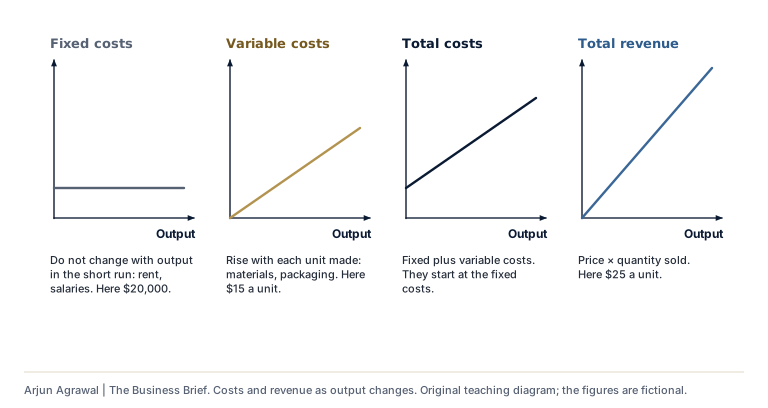
Four small charts against output, using fictional figures. Fixed costs, such as rent and salaries, stay at $20,000 whatever the output in the short run. Variable costs, such as materials and packaging, rise by $15 with each unit. Total costs are fixed plus variable costs, so they start at $20,000 and rise by $15 a unit. Total revenue is price times quantity sold, rising by $25 a unit from zero. Costs can also be direct, traced to one product, or indirect overheads shared across products.
Section 01: Where it is used
- 5.5 Break-even analysis: Contribution per unit and total contribution In the notes, where it is taught
- 3.3 Costs and revenues On the subtopic’s page, with its other diagrams
- 5.5 Break-even analysis On the subtopic’s page, in its notes
Arjun Agrawal | The Business Brief, https://the-business-brief-dun.vercel.app/diagrams/costs-and-revenue-lines/. Original teaching material, not an IB publication. The organizations in the teaching cases are fictional unless a case says otherwise.