Diagram · Unit 3 · 3.4, 3.5
The statement of profit or loss, line by line
Text description
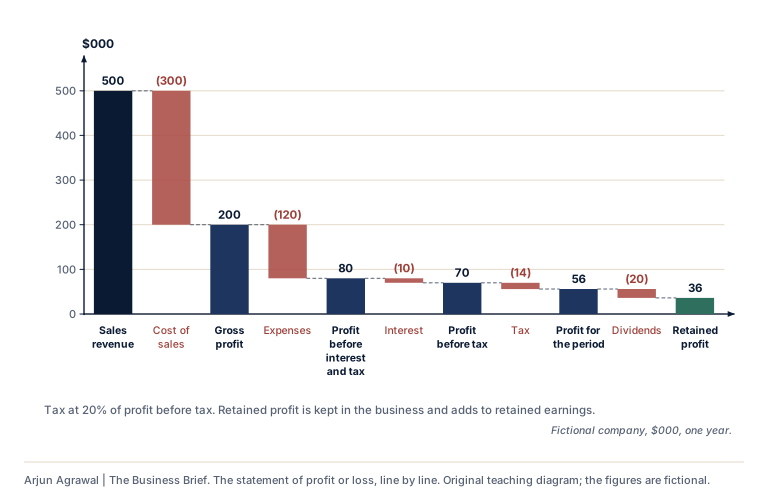
A waterfall chart of a fictional company’s statement of profit or loss, in thousands of dollars. Sales revenue 500, less cost of sales 300, gives gross profit 200. Less expenses 120 gives profit before interest and tax 80. Less interest 10 gives profit before tax 70. Less tax 14, at 20%, gives profit for the period 56. Less dividends 20 leaves retained profit 36, which is kept in the business.
Section 01: Where it is used
- 3.4 Final accounts: The statement of profit or loss In the notes, where it is taught
- 3.5 Profitability and liquidity ratio analysis: Profitability ratios In the notes, where it is taught
- 3.4 Final accounts On the subtopic’s page, in its notes
- 3.5 Profitability and liquidity ratio analysis On the subtopic’s page, in its notes
Arjun Agrawal | The Business Brief, https://the-business-brief-dun.vercel.app/diagrams/profit-or-loss-waterfall/. Original teaching material, not an IB publication. The organizations in the teaching cases are fictional unless a case says otherwise.