Diagram · Unit 3 · 3.4, 3.5
The statement of financial position
Text description
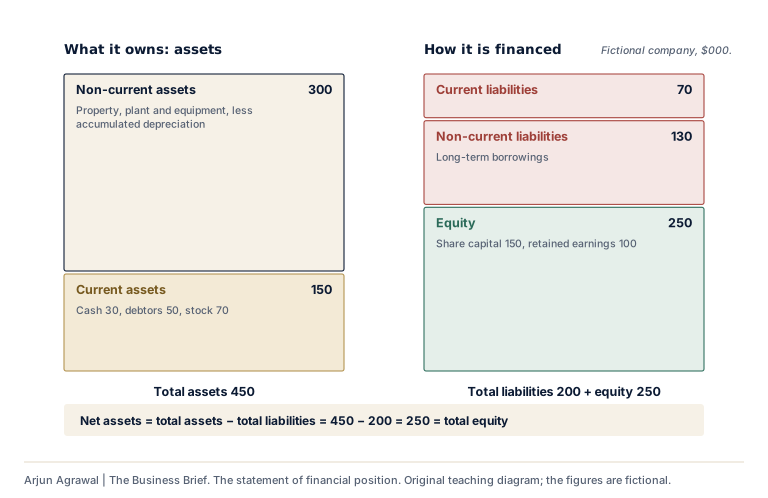
Two columns of equal height for a fictional company, in thousands of dollars. What it owns: non-current assets 300, property, plant and equipment less accumulated depreciation, and current assets 150, made of cash 30, debtors 50 and stock 70; total assets 450. How it is financed: current liabilities 70, non-current liabilities 130 in long-term borrowings, and equity 250, made of share capital 150 and retained earnings 100. Net assets, total assets minus total liabilities, are 250, equal to total equity.
Section 01: Where it is used
- 3.4 Final accounts: The statement of financial position In the notes, where it is taught
- 3.1 Introduction to finance: How each kind of spending affects profit and cash In the notes, where it is taught
- 3.5 Profitability and liquidity ratio analysis: Liquidity ratios In the notes, where it is taught
- 3.4 Final accounts On the subtopic’s page, in its notes
- 3.5 Profitability and liquidity ratio analysis On the subtopic’s page, in its notes
Arjun Agrawal | The Business Brief, https://the-business-brief-dun.vercel.app/diagrams/financial-position-balance/. Original teaching material, not an IB publication. The organizations in the teaching cases are fictional unless a case says otherwise.