Diagram · Unit 4 · 4.1
Market share and market growth
Text description
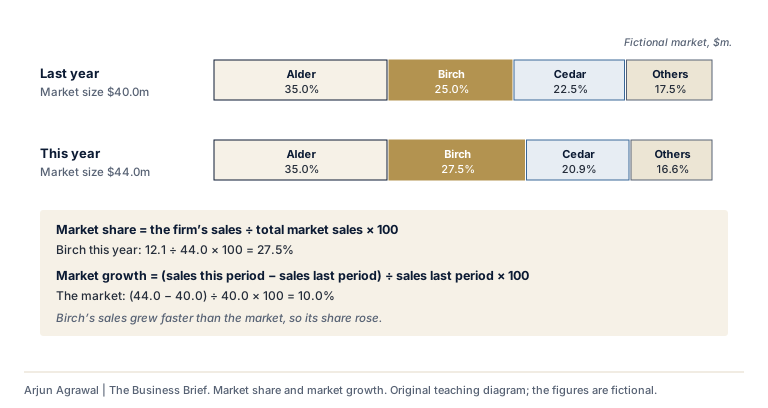
Two bars show a fictional market divided between four sellers, last year and this year. The market grew from $40.0m to $44.0m, market growth of 10.0%. Alder: 35.0% then 35.0%; Birch: 25.0% then 27.5%; Cedar: 22.5% then 20.9%; Others: 17.5% then 16.6%. Market share is the firm’s sales divided by total market sales times 100; Birch’s sales of $12.1m give 27.5%. Its sales grew faster than the market, so its share rose.
Section 01: Where it is used
- 4.1 Introduction to marketing: Market share In the notes, where it is taught
- 4.1 Introduction to marketing On the subtopic’s page, in its notes
Arjun Agrawal | The Business Brief, https://the-business-brief-dun.vercel.app/diagrams/market-share-growth/. Original teaching material, not an IB publication. The organizations in the teaching cases are fictional unless a case says otherwise.