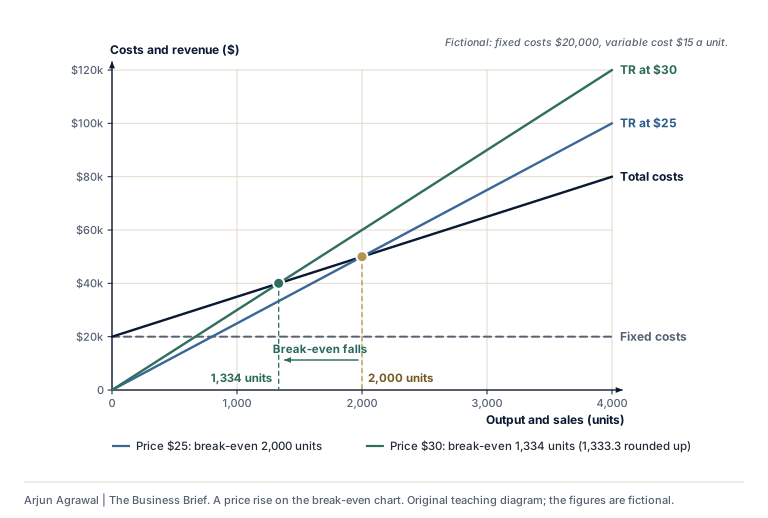
A price rise on the break-even chart A higher price steepens total revenue and lowers the break-even quantity.Text description
Break-even chart with fixed costs of $20,000 and a variable cost of $15 a unit. At a price of $25 total revenue meets total costs at 2,000 units. When the price rises to $30, the total revenue line becomes steeper and meets total costs at 1,333.3 units, rounded up to 1,334. A higher price lowers the break-even quantity, although sales may fall at the higher price.
Arjun Agrawal | The Business Brief, https://the-business-brief-dun.vercel.app/diagrams/break-even-price-change/. Original teaching material, not an IB publication.
The organizations in the teaching cases are fictional unless a case says otherwise.