Diagram · The business management toolkit · 1.5, 5.4

A decision tree

SL and HL Fictional figures
A decision treeA fictional retailer chooses between two options. Opening a second store costs $200k: success, with probability 0.6, returns $500k; failure, with probability 0.4, returns $150k. Its expected value is 0.6 × 500 + 0.4 × 150 = $360k, a net $160k after the cost. Refurbishing the existing store costs $80k: high demand, probability 0.7, returns $250k; low demand, probability 0.3, returns $100k. Its expected value is $205k, a net $125k. On expected value alone the retailer opens the second store, and the refurbishment branch is marked as rejected. Square nodes are decisions, circles are chance events, and the probabilities are estimates.Choose: $160kOpen a second storeCost −$200kEV $360kNet $360k − $200k = $160kSuccess 0.6$500k0.6 × 500 = 300Failure 0.4$150k0.4 × 150 = 60Refurbish the storeCost −$80kEV $205kNet $205k − $80k = $125kHigh demand 0.7$250k0.7 × 250 = 175Low demand 0.3$100k0.3 × 100 = 30DecisionChance// rejected optionFictional figures, $000. Probabilities are estimates.
A decision treeA fictional retailer chooses between two options. Opening a second store costs $200k: success, with probability 0.6, returns $500k; failure, with probability 0.4, returns $150k. Its expected value is 0.6 × 500 + 0.4 × 150 = $360k, a net $160k after the cost. Refurbishing the existing store costs $80k: high demand, probability 0.7, returns $250k; low demand, probability 0.3, returns $100k. Its expected value is $205k, a net $125k. On expected value alone the retailer opens the second store, and the refurbishment branch is marked as rejected. Square nodes are decisions, circles are chance events, and the probabilities are estimates.Decide: the higher net value, $160kOpen a second storeCost −$200kEV $360k, net $160kSuccess, 0.6: $500k0.6 × 500 = 300Failure, 0.4: $150k0.4 × 150 = 60Refurbish the store (rejected)Cost −$80kEV $205k, net $125kHigh demand, 0.7: $250k0.7 × 250 = 175Low demand, 0.3: $100k0.3 × 100 = 30Square: a decision. Circle: chance.Fictional figures, $000; probabilitiesare estimates.

A decision tree Expected values for two options, with the rejected branch marked.
Text description

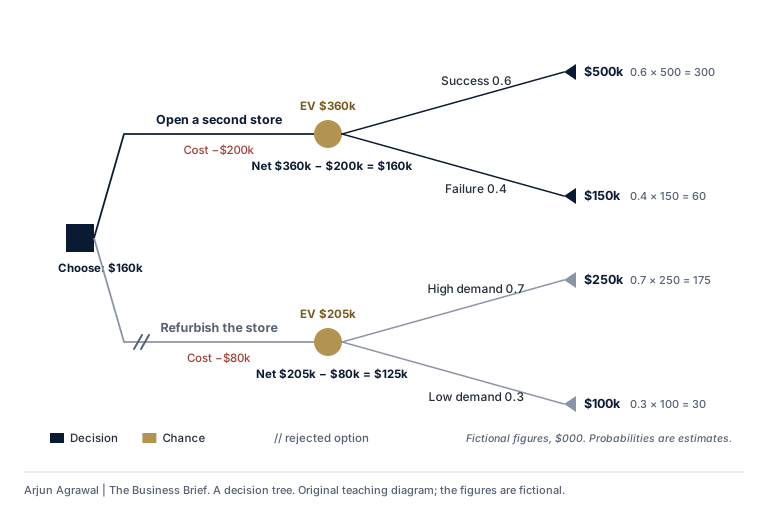
A fictional retailer chooses between two options. Opening a second store costs $200k: success, with probability 0.6, returns $500k; failure, with probability 0.4, returns $150k. Its expected value is 0.6 × 500 + 0.4 × 150 = $360k, a net $160k after the cost. Refurbishing the existing store costs $80k: high demand, probability 0.7, returns $250k; low demand, probability 0.3, returns $100k. Its expected value is $205k, a net $125k. On expected value alone the retailer opens the second store, and the refurbishment branch is marked as rejected. Square nodes are decisions, circles are chance events, and the probabilities are estimates.

Download SVG

Section 01: Where it is used