Diagram · Unit 4 · 4.5

The product life cycle, with cash flow

SL and HL
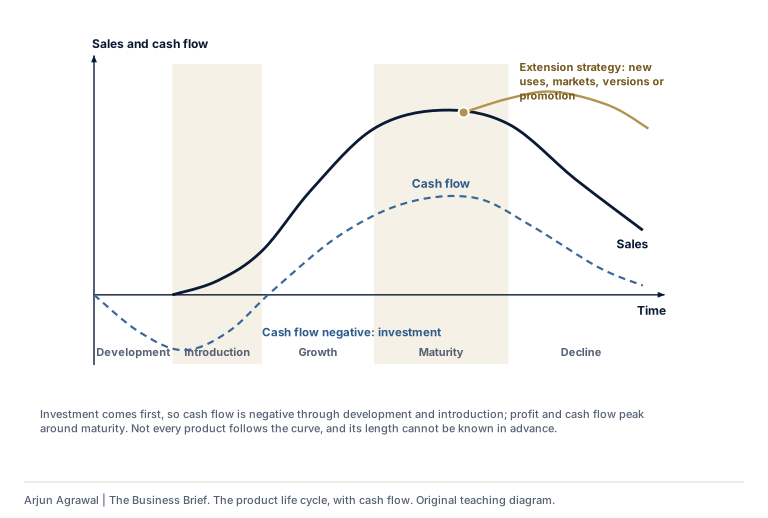
The product life cycle, with cash flowSales over time through five stages: development, with no sales; introduction, with slow sales; growth, with sales rising fast; maturity, where sales level off and peak; and decline. A dashed line shows cash flow: negative through development and introduction, when the business invests, turning positive in growth and peaking around maturity. A second curve in maturity shows an extension strategy, such as new uses, markets, versions or promotion, lifting sales again. Not every product follows the curve, and its length cannot be known in advance.DevelopmentIntroductionGrowthMaturityDeclineTimeSales and cash flowExtension strategy: newuses, markets, versions orpromotionSalesCash flow negative: investmentCash flowInvestment comes first, so cash flow is negative through development and introduction; profit and cash flow peakaround maturity. Not every product follows the curve, and its length cannot be known in advance.
The product life cycle, with cash flowSales over time through five stages: development, with no sales; introduction, with slow sales; growth, with sales rising fast; maturity, where sales level off and peak; and decline. A dashed line shows cash flow: negative through development and introduction, when the business invests, turning positive in growth and peaking around maturity. A second curve in maturity shows an extension strategy, such as new uses, markets, versions or promotion, lifting sales again. Not every product follows the curve, and its length cannot be known in advance.Sales and cash flow123451 Development, 2 Introduction, 3Growth, 4 Maturity, 5 DeclineSalesCash flow: negative while thebusiness investsAn extension strategy liftingsales in maturityNot every product follows the curve,and its length cannot be known inadvance.

The product life cycle, with cash flow Five stages, an extension strategy, and why cash flow lags sales.
Text description

Sales over time through five stages: development, with no sales; introduction, with slow sales; growth, with sales rising fast; maturity, where sales level off and peak; and decline. A dashed line shows cash flow: negative through development and introduction, when the business invests, turning positive in growth and peaking around maturity. A second curve in maturity shows an extension strategy, such as new uses, markets, versions or promotion, lifting sales again. Not every product follows the curve, and its length cannot be known in advance.

Download SVG

Section 01: Where it is used