Diagram · Unit 4 · 4.2
A position map
Text description
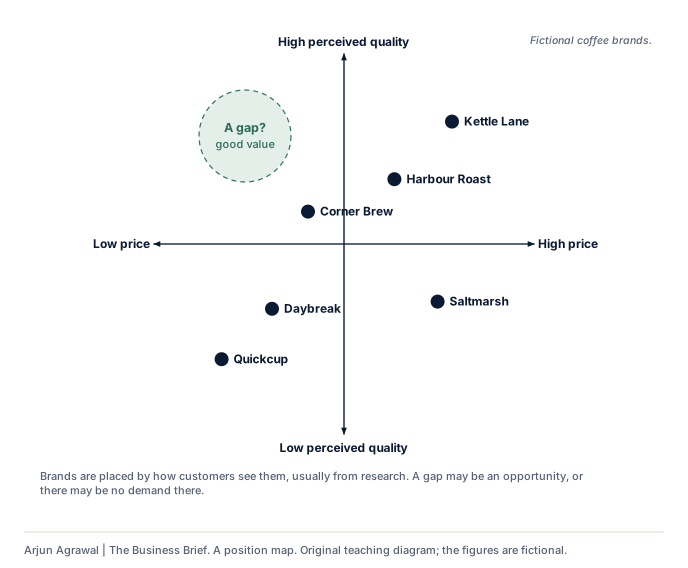
A position map of six fictional coffee brands, with price from low to high across and perceived quality from low to high up. Kettle Lane: price 8 out of 10, quality 8.4; Daybreak: price 3 out of 10, quality 3.2; Harbour Roast: price 6.4 out of 10, quality 6.8; Quickcup: price 1.6 out of 10, quality 1.8; Saltmarsh: price 7.6 out of 10, quality 3.4; Corner Brew: price 4 out of 10, quality 5.9. A circle marks a possible gap: good perceived quality at a modest price. Brands are placed by how customers see them; a gap may be an opportunity, or there may be no demand there.
Section 01: Where it is used
- 4.2 Marketing planning: Positioning and position maps In the notes, where it is taught
- 4.2 Marketing planning On the subtopic’s page, in its notes
Arjun Agrawal | The Business Brief, https://the-business-brief-dun.vercel.app/diagrams/position-map/. Original teaching material, not an IB publication. The organizations in the teaching cases are fictional unless a case says otherwise.