Diagram · Unit 1 · 1.5
Economies and diseconomies of scale
Text description
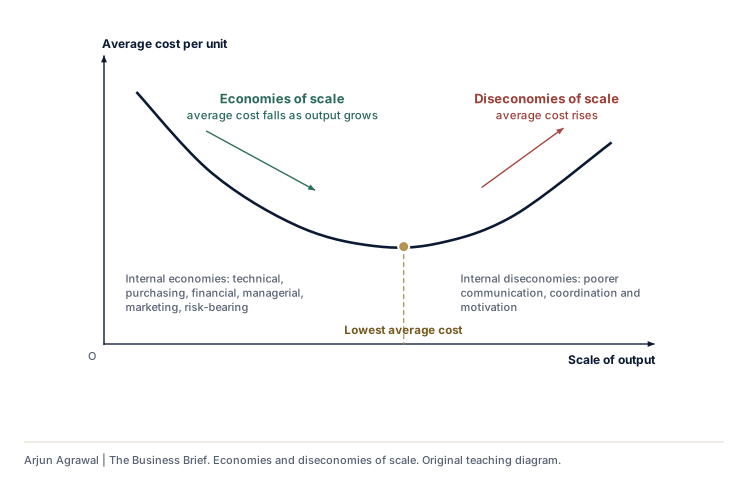
A U-shaped curve of average cost per unit against the scale of output. On the left, economies of scale: average cost falls as output grows, through technical, purchasing, financial, managerial, marketing and risk-bearing economies. The curve reaches its lowest average cost, then rises on the right, where diseconomies of scale such as poorer communication, coordination and motivation push average cost up. External economies and diseconomies, which come from the industry or area rather than the firm, shift the whole curve.
Section 01: Where it is used
- 5.4 Location: How the type of business shapes its location In the notes, where it is taught
- 5.2 Operations methods: Volume decides: comparing methods by their costs In the notes, where it is taught
- 1.5 Growth and evolution On the subtopic’s page, with its other diagrams
Arjun Agrawal | The Business Brief, https://the-business-brief-dun.vercel.app/diagrams/economies-of-scale/. Original teaching material, not an IB publication. The organizations in the teaching cases are fictional unless a case says otherwise.