Diagram · Unit 3 · 3.7
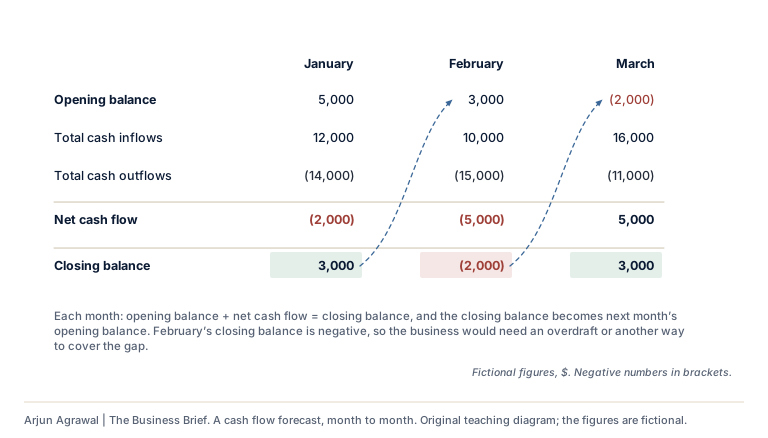
A cash flow forecast, month to month
Text description
A three-month cash flow forecast in the guide’s layout. January: opening balance 5,000, total cash inflows 12,000, total cash outflows 14,000, net cash flow (2,000), closing balance 3,000. February: opening balance 3,000, total cash inflows 10,000, total cash outflows 15,000, net cash flow (5,000), closing balance (2,000). March: opening balance (2,000), total cash inflows 16,000, total cash outflows 11,000, net cash flow 5,000, closing balance 3,000. Each closing balance becomes the next month’s opening balance. February’s closing balance is negative, so the business would need an overdraft or another way to cover the gap.
Section 01: Where it is used
- 3.7 Cash flow: Cash flow forecasts In the notes, where it is taught
- 3.7 Cash flow On the subtopic’s page, in its notes
Arjun Agrawal | The Business Brief, https://the-business-brief-dun.vercel.app/diagrams/cash-flow-forecast/. Original teaching material, not an IB publication. The organizations in the teaching cases are fictional unless a case says otherwise.