Diagram · Unit 3 · 3.8
Payback and the average rate of return
Text description
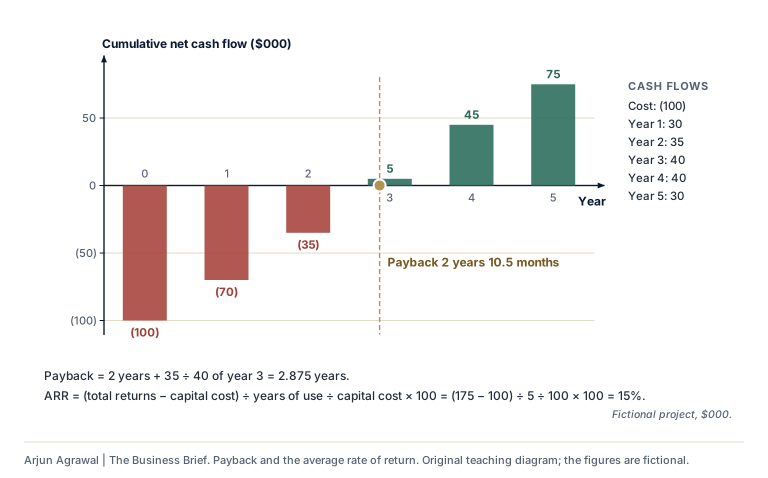
A fictional project costs $100k and returns net cash flows of 30, 35, 40, 40, 30 thousand dollars over five years. Bars show the cumulative net cash flow each year: (100), (70), (35), 5, 45, 75. It turns positive during year 3, giving a payback period of 2.875 years, or 2 years and 10.5 months. The average rate of return is (175 − 100) ÷ 5 ÷ 100 × 100 = 15%.
Section 01: Where it is used
- 3.1 Introduction to finance: Planning capital expenditure In the notes, where it is taught
- 3.8 Investment appraisal: The payback period In the notes, where it is taught
- 3.8 Investment appraisal On the subtopic’s page, in its notes
Arjun Agrawal | The Business Brief, https://the-business-brief-dun.vercel.app/diagrams/payback-arr/. Original teaching material, not an IB publication. The organizations in the teaching cases are fictional unless a case says otherwise.