Diagram · Unit 5 · 5.6
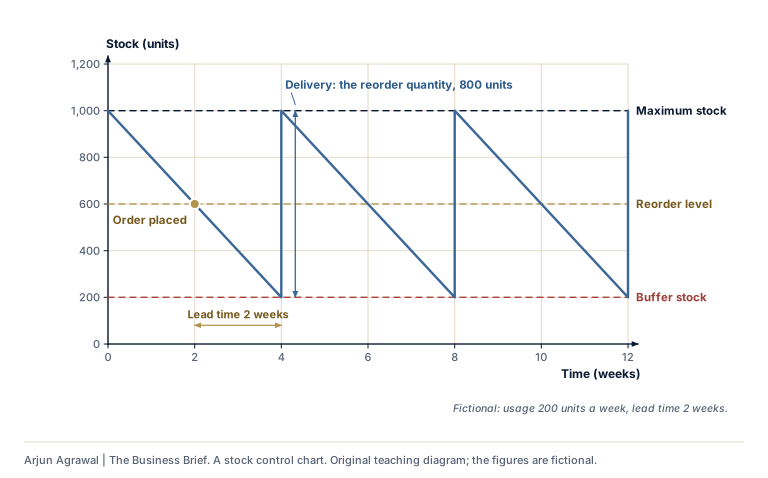
A stock control chart
Text description
Stock control chart over 12 weeks. Stock falls steadily from a maximum of 1,000 units at 200 units a week. An order is placed when stock reaches the reorder level of 600 units, the buffer stock of 200 plus 2 weeks of usage. The order of 800 units, the reorder quantity, arrives after the 2-week lead time, just as stock reaches the buffer stock, taking stock back to the maximum. The cycle repeats every 4 weeks.
Section 01: Where it is used
- 5.6 Production planning: Stock control charts In the notes, where it is taught
- 5.6 Production planning On the subtopic’s page, in its notes
Arjun Agrawal | The Business Brief, https://the-business-brief-dun.vercel.app/diagrams/stock-control-chart/. Original teaching material, not an IB publication. The organizations in the teaching cases are fictional unless a case says otherwise.