Diagram · The business management toolkit · 5.1, 4.2

A Gantt chart

HL only Fictional figures
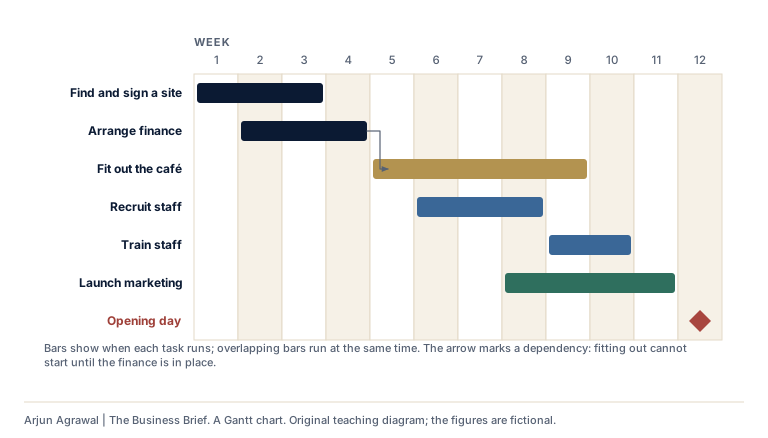
A Gantt chartA Gantt chart for opening a fictional café over 12 weeks. Find and sign a site: weeks 1 to 3. Arrange finance: weeks 2 to 4. Fit out the café: weeks 5 to 9. Recruit staff: weeks 6 to 8. Train staff: weeks 9 to 10. Launch marketing: weeks 8 to 11. Opening day is a milestone in week 12. Overlapping bars run at the same time, and an arrow shows that fitting out cannot start until the finance is in place.123456789101112WEEKFind and sign a siteArrange financeFit out the caféRecruit staffTrain staffLaunch marketingOpening dayBars show when each task runs; overlapping bars run at the same time. The arrow marks a dependency: fitting out cannotstart until the finance is in place.
A Gantt chartA Gantt chart for opening a fictional café over 12 weeks. Find and sign a site: weeks 1 to 3. Arrange finance: weeks 2 to 4. Fit out the café: weeks 5 to 9. Recruit staff: weeks 6 to 8. Train staff: weeks 9 to 10. Launch marketing: weeks 8 to 11. Opening day is a milestone in week 12. Overlapping bars run at the same time, and an arrow shows that fitting out cannot start until the finance is in place.123456789101112Find and sign a siteArrange financeFit out the caféRecruit staffTrain staffLaunch marketingOpening dayWeeks across the top. Overlapping barsrun at the same time; fitting outcannot start until the finance is inplace.

A Gantt chart HL Tasks against time, with overlaps, a dependency and a milestone.
Text description

A Gantt chart for opening a fictional café over 12 weeks. Find and sign a site: weeks 1 to 3. Arrange finance: weeks 2 to 4. Fit out the café: weeks 5 to 9. Recruit staff: weeks 6 to 8. Train staff: weeks 9 to 10. Launch marketing: weeks 8 to 11. Opening day is a milestone in week 12. Overlapping bars run at the same time, and an arrow shows that fitting out cannot start until the finance is in place.

Download SVG

Section 01: Where it is used