Unit 3: Finance and accounts
3.8 Investment appraisal
Study mode could not start. The page reads as usual.
Study mode
On this page
Section 01: What the IB course asks
The content statements for 3.8, in the platform's words, with the depth of teaching the guide sets (guide, from p. 30).
- Investment opportunities appraised by payback period and average rate of return (ARR) AO3, AO4
- Net present value (NPV) AO3, AO4 HL
AO1 knowledge and understanding · AO2 application and analysis · AO3 synthesis and evaluation · AO4 a range of skills. A question can use a command term at its statement's level or below. The whole course.
Section 02: Why it matters
Buying a machine, opening a branch or launching a website means spending a large sum now in the hope of returns spread over several years. Once the money is spent it is hard to get back, so managers need a disciplined way to decide whether a project is worth its cost, and which of several projects to choose.
Investment appraisal provides it. All students use two methods: the payback period, which asks how quickly the money comes back, and the average rate of return (ARR), which asks how profitable the project is on average. HL students add net present value (NPV), which allows for the fact that money received later is worth less than money today. The guide asks for judgement (AO3) as well as calculation (AO4), so working out the numbers is only half the task: you must also weigh how far to trust them.
By the end you can
- Calculate the payback period and the average rate of return (ARR) from a project's capital cost and net cash flows.
- Calculate net present value (NPV) using the guide's discount table (HL only).
- Explain what each method measures, and what each leaves out.
- Compare investment opportunities using more than one method, including why the methods can rank them differently.
- Evaluate an investment decision, weighing the results against the reliability of the forecasts and the qualitative factors.
Section 03: What investment appraisal does
An investment here means capital expenditure on a project that will last for more than a year: new machinery, a fleet of vans, an IT system, a new outlet or a new product line. Investment appraisal compares what the project costs now with the returns it is expected to bring in over its life, and uses the comparison to accept or reject it, or to rank several projects competing for the same money.
The returns are the project's net cash flows: the extra cash it brings in each year minus the extra cash it costs to run. They are forecasts, and that is the weakness every method shares. The figures for year five are guesses made today.
Businesses appraise investments with care for three reasons. The sums are large, often a big share of what the business has. The decision is hard to reverse, because specialist equipment sells for far less than it cost. And money spent on one project cannot be spent on another, so every choice has an opportunity cost.
- Capital cost
What the project costs at the start. It is paid now, so in calculations it sits in "year 0".
- Returns
The project's net cash flow in each year of use, the extra cash inflows it brings minus the extra cash outflows it causes.
- Years of use
The expected life of the project, which is the number of years of returns the calculation includes.
- Cumulative net cash flow
The running total of the capital cost (a negative figure) and the returns so far. It turns positive in the year the project pays for itself.
Section 04: The payback period
The payback period is the time a project takes for its net cash flows to add up to its capital cost. It answers one question: how long is the money at risk?
To find it, keep a running total of the cash flows, starting with the capital cost as a negative figure. The project pays back in the year the running total turns positive. To find how far into that year, divide the amount still to recover at the start of the year by that year's net cash flow, and multiply by 12 to turn the fraction into months. This assumes that the year's cash arrives evenly, month by month, so say so in your answer.
Many businesses set a maximum payback, such as three years, and reject projects that take longer. A short payback matters most to a business that is short of cash, borrowing at a high rate of interest, or selling in a market where products or technology go out of date quickly. You can test your own figures on the investment appraisal desk.
Text description
A fictional project costs $100k and returns net cash flows of 30, 35, 40, 40, 30 thousand dollars over five years. Bars show the cumulative net cash flow each year: (100), (70), (35), 5, 45, 75. It turns positive during year 3, giving a payback period of 2.875 years, or 2 years and 10.5 months. The average rate of return is (175 − 100) ÷ 5 ÷ 100 × 100 = 15%.
Payback period
Payback period = years before the cost is recovered + (amount still to recover ÷ net cash flow in the payback year) × 12 months
The guide's formula sheet gives no formula for payback; this is the standard method. The answer can also be given as a decimal of years, for example 2.875 years.
Advantages
- Quick to calculate and easy for managers, owners and lenders to understand.
- Favours projects that return cash quickly, which helps liquidity and suits a business that is short of cash.
- Limits risk, because the sooner the cost is recovered, the less the decision depends on distant and unreliable forecasts.
- Suits markets where products or technology date quickly and later returns are doubtful.
Limitations
- Ignores every return after the payback point, so it says nothing about a project's total profitability.
- Treats a dollar received in year 3 as worth the same as a dollar today, ignoring the time value of money.
- The months figure depends on assuming that cash arrives evenly through the year.
- A maximum payback is a judgement, and it can reject long-term projects, such as research or new premises, that would earn far more in the end.
Section 05: The average rate of return (ARR)
The average rate of return measures a project's average yearly profit as a percentage of its capital cost. Unlike payback, it uses every year's returns, so it measures profitability rather than speed. Work it in four steps:
- Add up the returns over the project's life (the total returns).
- Subtract the capital cost to find the total net return, the project's profit over its life.
- Divide by the years of use to find the average net return a year.
- Divide by the capital cost and multiply by 100.
An ARR means little on its own. Compare it with a benchmark: the interest rate the business would pay to borrow the money, what the money would earn in a bank account, the ARR of other projects, or a minimum rate the owners have set. A project whose ARR is below the cost of borrowing would leave the business worse off once the interest is paid.
Some textbooks and accountants use a different ARR, based on accounting profit after depreciation or on the average amount invested. For the IB, use the guide's formula, which divides the average yearly net return by the capital cost.
Average rate of return (ARR)
ARR = ((total returns − capital cost) ÷ years of use) ÷ capital cost × 100
As on the guide's formula sheet (p. 65). The answer is a percentage a year.
Advantages
- Uses the returns over the whole life of the project, so it measures profitability.
- A percentage is easy to compare with interest rates, with other projects and with a target rate of return.
- Easy to explain to owners and lenders, who are used to judging returns as percentages.
Limitations
- Ignores when the returns arrive, so a project whose returns come in year 5 can score as well as one whose returns come in year 1, although early cash is worth more and is less risky.
- Depends on forecasts for every year of the project's life, including the distant years, which are the least reliable.
- An average can hide years of losses or a long wait before any return.
- Other definitions of ARR exist, so results from different sources may not be comparable.
HL Section 06, Net present value (NPV), is HL only and is hidden while you are viewing SL content. Switch to HL at the top of the page to see it.
Section 06: Net present value (NPV)
HL onlyPayback and ARR treat a dollar received in year 5 as worth the same as a dollar today. It is not. Money held today can be invested to earn interest, future returns are less certain, and inflation erodes what money will buy. This is the time value of money.
Net present value allows for it by discounting: converting each future return into its present value, the sum that would be worth the same to the business today. Each year's return is multiplied by a discount factor, read from a table for the chosen rate and year. The further away the return and the higher the rate, the smaller the factor, so later returns count for less. The present values are then added and the original cost is subtracted. The cost is paid now, so it is already in today's money and is not discounted.
The discount rate is a decision in itself. Businesses often use the interest rate they pay to borrow, or the return they could earn elsewhere, with an allowance for risk. A positive NPV means the project earns more than that rate and adds value; a negative NPV means it earns less and, on financial grounds, should be rejected; an NPV of zero means it earns exactly the rate.
The guide's discount table, supplied in the examination when a question needs it, gives factors to four decimal places for rates of 4%, 6%, 8%, 10% and 20% over years 1 to 10. Use the printed factors. One of them, 6% in year 8, is printed as 0.6271, slightly different from the 0.6274 the formula gives; the table is what the examination uses.
Text description
The same fictional project, with each year’s net cash flow beside its present value at a 10% discount rate, using the guide’s discount factors (0.9091, 0.8264, 0.7513, 0.6830, 0.6209). The present values are 27.3, 28.9, 30.1, 27.3, 18.6, a total of 132.2 thousand dollars. Less the original cost of 100, the net present value is 32.2 thousand dollars, positive, so the project earns more than the 10% rate used.
Present value
Present value = return in a year × discount factor for that year and rate
The standard form. Read the factor from the guide's table (p. 66), and do not discount the original cost.
Net present value (NPV)
NPV = ∑ present values of return − original cost
As on the guide's formula sheet (p. 65). ∑ means "the sum of".
Discount factor
Discount factor = 1 ÷ (1 + r)ⁿ
Where r is the discount rate as a decimal and n is the number of years. Shown so that you can see where the table comes from; in the examination, use the table.
Advantages
- Allows for the time value of money, so early returns count for more than late ones.
- Uses all the returns over the project's life.
- Gives an answer in money, the value the project adds in today's terms, which links directly to the owners' wealth.
- The discount rate can be raised for riskier projects, so risk is built into the result.
Limitations
- The result depends heavily on the discount rate, which is a judgement.
- Harder to calculate and to explain to non-specialists than payback or ARR.
- Still rests on forecasts of every year's returns, and treats each year's return as arriving at the end of the year.
- An NPV in money does not show the return on each dollar invested, so it can mislead when projects differ greatly in size.
Section 07: Comparing the methods
Each method answers a different question, so the methods can rank the same projects differently. Payback asks how fast: it rewards early cash and low risk. ARR asks how profitable: it rewards high total returns, whenever they arrive. At HL, NPV asks how much value in today's money: it rewards high returns, and early ones more than late ones.
Quillmoor Print shows the clash. Project B pays back sooner (2 years 6 months, against 2 years 10.5 months), but Project A has the far higher ARR (15%, against 6%). Which matters more depends on the business. If Quillmoor were short of cash, or expected its market to change fast, the quicker payback might win; if it can afford to wait, Project A's profitability should. At HL, ARR and NPV can disagree as well, as Project C in the NPV section shows.
In practice businesses use the methods together: a maximum payback as a first screen for risk, then ARR (and NPV at HL) to judge profitability. A strong examination answer does the same. It calculates, compares each result with a benchmark from the case, and says which result matters most for this business.
- Payback first
When cash is short, the market or technology is changing quickly, or the owners are cautious about risk.
- ARR first
When the business can afford to wait for its returns and wants the most profitable use of its funds, or has to beat a target rate of return.
- When the methods agree
If one project wins on every measure, the numbers point one way, and the decision turns on the qualitative factors and on whether the business can finance the project.
Section 08: Qualitative factors and risk
Investment appraisal turns a decision into numbers, but the numbers rest on forecasts and leave out much of what matters. Before deciding, managers weigh how reliable the forecasts are and the qualitative factors: the effects that cannot easily be measured in money.
Forecasts are least reliable for new products, new markets and distant years. One way to test them is to ask what if: what if the returns are 20% lower, or arrive a year late? A project that still passes is a safer choice than one that only works if every forecast comes true.
- Objectives and strategy
Does the project fit what the business is trying to achieve? A project with a lower return may still be chosen because it supports growth, quality or the brand.
- Employees
Automation may cut costs but bring redundancies, retraining and lower morale. A project that needs new skills needs staff who have them, or time and money to train them.
- Ethics and the environment
Effects on pollution, energy use, waste and the local community matter to stakeholders, to the business's reputation and, increasingly, to the law.
- Finance and cash flow
A profitable project still has to be paid for. The availability and cost of finance, and the strain on cash while the business waits for the returns, can rule a project out.
- The external environment
Changes in interest rates, inflation, exchange rates, technology, the law or competitors' actions can all make the forecasts wrong. A rise in interest rates also raises the benchmark a project must beat.
- Risk and flexibility
A project that can be scaled back, sold or adapted if things go wrong carries less risk than one that cannot.
Section 09: In practice: industries and stakeholders
The same ideas look different from one industry to the next, and land differently on each group with a stake in the business.
Across industries
- Manufacturing
Machinery and production lines are large, long-lived and hard to resell, so manufacturers appraise them carefully, often with a maximum payback as a first screen. Automation is a common case, where the returns are mainly savings in labour and waste, and the qualitative side, retraining or redundancy, weighs heavily.
- Retail
A new store is judged on the extra cash it brings the whole business, so its returns should allow for any sales it takes from the business's own nearby stores. The lease fixes the project's life, and the footfall forecast for a new location is usually the least reliable figure in the appraisal.
- Technology
Products and equipment date quickly, so returns beyond two or three years are doubtful and businesses often demand a short payback. A project that pays off only in year five is a bet that the technology will still be current then.
- Energy and infrastructure
Wind farms, power lines and transport links last for decades, with returns spread over many years, so payback is long and, at HL, the choice of discount rate can decide whether the NPV is positive. A change in government subsidies or regulation can alter the returns after the money has been spent.
- Hotels and hospitality
Refurbishments, new rooms and new facilities are judged on extra bookings and higher prices, which depend on reviews, competitors and the economy. Some investment is needed simply to keep up with rivals, so a low return can still be the right choice when the alternative is losing guests.
- Healthcare and the public sector
Many benefits, such as shorter waiting times or better health, are not cash flows at all, so investment appraisal is used alongside measures of social value. A scanner that pays back slowly in money may still be the best use of a hospital's funds.
For each stakeholder
- Owners and shareholders
Want the project that adds the most value, which ARR and, at HL, NPV measure, but they also carry the risk if the forecasts fail. A long project can mean smaller dividends while the business waits for its returns, which divides owners who want income now from those who want growth.
- Lenders
Care whether the project's cash flows will repay the loan on time, so payback and the timing of cash matter to them more than total returns. A bank may lend for a project with a modest ARR but quick, reliable cash flows, and refuse one with a high ARR that takes years to pay back.
- Employees
Investment in automation can raise productivity and cut costs, often by replacing jobs, while investment in new products or sites can create them. Employees may resist a project that the numbers favour, and their reaction is a qualitative factor that can decide whether it succeeds.
- Managers
Prepare the forecasts and are often judged on the results, which can bias them towards optimism about their own proposals. A manager judged on this year's profit may also prefer a quick payback to a project with greater long-term value.
- Customers
Benefit from investment in better products, faster service or lower costs, but may face higher prices if a project has to be paid for. A business that stops investing to protect its cash can fall behind what its customers expect.
- Local community and environment
A new factory or extension brings jobs but also traffic, noise and emissions, while cleaner technology can benefit the community even if its ARR is modest. Planning authorities and pressure groups can delay or block a project, a risk the appraisal itself does not show.
Section 10: Evaluation and limits
What to weigh before reaching a judgement.
- No method is complete on its own. Payback measures speed and risk, ARR measures profitability and, at HL, NPV measures value in today's money. The best answers use more than one and explain why they disagree.
- Every result is only as reliable as the forecasts behind it, and forecasts become less reliable the further ahead they look. A long project whose returns come mostly in its later years carries the most forecasting risk.
- The benchmark matters as much as the result. An ARR of 9% is attractive when loans cost 5% and poor when they cost 10%; at HL, raising the discount rate can turn a positive NPV negative.
- A project can pass every test and still be wrong for the business, because of its effects on staff, the environment, the brand or the business's objectives, or because it cannot be financed without straining cash flow.
- In an examination answer, show every step, state the assumption that cash arrives evenly when you give payback in months, compare each result with a benchmark from the case, and end with a judgement that weighs the numbers against at least one qualitative factor.
Section 11: Make the decision
Use the ideas on a business choice: weigh the options, decide, and say what would change your mind.
Decision brief · a fictional business
Rooms, sunshine or a spa?
Fernbrook Lodge, a fictional hotel in the mountains, has $240,000 to invest and three proposals, each costing that amount. It can borrow at 7% a year, and its owners want any project to beat that rate.
- Refurbishing its rooms would lift prices and bookings: net cash flows of $100,000, $80,000, $60,000, $40,000 and $20,000 over five years, falling as the rooms age again.
- Solar panels and a heat pump would cut its energy bills by about $60,000 a year for eight years.
- A small spa would take time to build a following: $30,000, $50,000 and $70,000 in its first three years, then $80,000 a year in years 4 to 6.
How to weigh the options
The numbers point two ways. On payback the rooms win; on ARR the solar scheme wins clearly, and the rooms fail the 7% test. Which matters more depends on Fernbrook's position: if cash is tight or the market uncertain, having the money back in three years is worth a great deal; if the hotel can wait, ARR measures what each dollar earns.
Next, test the forecasts. The solar savings depend on energy prices for eight years, the longest forecast here, but they are savings on bills the hotel already pays, which are easier to predict than new demand. The spa's returns rest on guests the hotel does not yet have, and most of them come in years 4 to 6, the least reliable years. The rooms' returns are the nearest and, for an existing hotel, the best understood.
Then the qualitative factors. Worn rooms hurt reviews and prices, so refurbishment protects the core business even with a low ARR, and putting it off may cost more than the forecast shows. Solar power cuts emissions, which many guests and the local community value, and protects the hotel against rising energy prices. The spa needs trained staff and fits a strategy of longer stays, but it is the riskiest of the three.
A defensible choice is the solar scheme, the most profitable return and among the most predictable, with the refurbishment next, provided worn rooms are not yet losing bookings; if they are, the rooms come first despite their ARR. HL students can add NPV: discounted at 8% with the guide's table, the refurbishment has a positive NPV even though its ARR is only 5%, because its returns arrive early, which ARR ignores. What would change the decision: a forecast of energy prices, evidence of demand for a spa, and recent guest reviews of the rooms.
Section 12: Exam-style practice
Original questions written by the platform in the style of the papers, with what a strong response does. They are not IB questions and the guidance is not an official markscheme.
-
Define the term investment appraisal.
What a strong response does
A strong response gives both parts: the use of quantitative methods, such as the payback period and the average rate of return, to judge whether an investment's expected returns justify its capital cost, and to compare or rank competing investment projects.
- Both the purpose (deciding whether to invest, or choosing between projects) and the basis (comparing expected returns with the cost) are needed.
- Naming the methods alone, without saying what they are for, earns little.
-
Thornbury Dairy, a fictional dairy farm, has $120,000 to invest and two options, each costing $120,000.
- A robotic milking system would last six years, with net cash flows of $20,000, $20,000, $30,000, $40,000, $40,000 and $30,000 in years 1 to 6.
- A farm shop would last four years, with net cash flows of $50,000, $40,000, $30,000 and $20,000 in years 1 to 4.
Calculate the payback period of each option.
What a strong response does
A strong response keeps a running total of the cash flows, starting with the capital cost, and states the assumption behind the months.
- Robotic milking system: cumulative net cash flow −$120,000, −$100,000, −$80,000, −$50,000, −$10,000 after year 4, then +$30,000 after year 5. During year 5: 10,000 ÷ 40,000 × 12 = 3 months, so payback is 4 years and 3 months.
- Farm shop: −$120,000, −$70,000, −$30,000, then exactly $0 after year 3, so payback is 3 years.
The months assume that year 5's cash arrives evenly through the year.
-
Using the figures in question 2, calculate the average rate of return (ARR) of each option.
What a strong response does
A strong response writes the guide's formula, ARR = ((total returns − capital cost) ÷ years of use) ÷ capital cost × 100, and works each step.
- Robotic milking system: total returns $180,000; (180,000 − 120,000) ÷ 6 = $10,000 a year; 10,000 ÷ 120,000 × 100 = 8.33%.
- Farm shop: total returns $140,000; (140,000 − 120,000) ÷ 4 = $5,000 a year; 5,000 ÷ 120,000 × 100 = 4.17%.
Dividing by the right number of years matters here, because the two options have different lives.
-
Explain why the payback period and the ARR rank Thornbury's two options differently.
What a strong response does
A strong response explains what each method measures and links that to the pattern of each option's cash flows.
- Payback measures speed. The farm shop's returns are largest at the start, $90,000 in its first two years, so it recovers its cost in 3 years, against 4 years and 3 months for the milking system, whose returns build up slowly.
- ARR measures average profitability over the whole life. The milking system goes on earning for six years and brings in $180,000 in total, against $140,000 over four years for the shop, so its ARR is about twice as high, 8.33% against 4.17%.
- Why they clash: payback ignores everything after the payback point, including the milking system's last $30,000, while ARR ignores when the returns arrive, so it gives no credit for the shop's early cash.
-
Thornbury Dairy can borrow at 7% a year. The milking system would replace much of the work of two part-time milkers and would record each cow's health and yield. The farm shop would sell the dairy's own milk and cheese to visitors, and would need two new staff.
Using your answers to questions 2 and 3, recommend which option Thornbury Dairy should choose.
What a strong response does
A strong response uses both methods and the benchmark, weighs the reliability of the forecasts and the qualitative factors, and makes a justified recommendation.
- Against the benchmark: the milking system's ARR of 8.33% clears the 7% cost of borrowing; the farm shop's 4.17% does not, so on profitability only the milking system is worth borrowing for.
- Speed and risk: the farm shop pays back sooner, in 3 years against 4 years and 3 months, which helps if cash is tight; but the milking system's returns in years 4 to 6, $110,000 of its $180,000, are the least reliable part of its forecast.
- Qualitative factors for the milking system: lower labour costs and better information on the herd's health, but less work for the two milkers, a technology the farm must learn, and machinery that could break down or date.
- Qualitative factors for the farm shop: a new source of income that spreads the dairy's risk beyond milk prices, closer links with the local community and higher margins on its own products, but it is a new market for the business, it depends on visitors and it needs new staff.
- Recommendation: for example, the milking system, since it is the only option that beats the cost of borrowing, with the milkers retrained to manage the herd; or the farm shop, if the owners value diversification and quick payback above profitability. A strong answer says what would change the choice: a more reliable forecast for the shop's later years, a fall in the interest rate, or a fall in milk prices that makes diversification more urgent. HL students can add the NPV from question 6.
-
Using the guide's discount factors at 8%, which are 0.9259, 0.8573, 0.7938, 0.7350, 0.6806 and 0.6302 for years 1 to 6, calculate the net present value (NPV) of each of Thornbury's options.
What a strong response does
A strong response discounts each year's net cash flow, adds the present values and subtracts the original cost, which is not discounted.
- Robotic milking system: 20,000 × 0.9259 = $18,518; 20,000 × 0.8573 = $17,146; 30,000 × 0.7938 = $23,814; 40,000 × 0.7350 = $29,400; 40,000 × 0.6806 = $27,224; 30,000 × 0.6302 = $18,906. Present values total $135,008, so NPV = 135,008 − 120,000 = +$15,008.
- Farm shop: 50,000 × 0.9259 = $46,295; 40,000 × 0.8573 = $34,292; 30,000 × 0.7938 = $23,814; 20,000 × 0.7350 = $14,700. Present values total $119,101, so NPV = 119,101 − 120,000 = −$899.
At 8%, the milking system adds value and the farm shop does not: discounting confirms the ARR ranking, even though the shop's returns arrive earlier.
HL Question 6 is HL only and hidden while you are viewing SL content. Switch to HL at the top of the page to see it.
Section 13: Revision summary
The subtopic on one page: what to remember.
- Investment appraisal compares a project's capital cost with its expected net cash flows, to accept or reject it or to rank competing projects.
- The payback period is the time the net cash flows take to add up to the capital cost. The months in the payback year are the amount still to recover ÷ that year's net cash flow × 12, assuming the cash arrives evenly.
- Payback rewards speed and limits risk, but ignores the returns after payback and the time value of money.
- ARR = ((total returns − capital cost) ÷ years of use) ÷ capital cost × 100, the guide's formula. Compare it with the cost of borrowing or a target rate.
- ARR uses every year's returns but ignores when they arrive, and other definitions of ARR exist, so use the guide's.
- (HL only) NPV = ∑ present values of return − original cost, where each present value is a year's return × the discount factor from the guide's table. The original cost is not discounted.
- (HL only) A positive NPV means the project earns more than the discount rate; a higher rate lowers every NPV, so the choice of rate can decide the result.
- The methods can rank projects differently, so use more than one, compare each result with a benchmark, test the forecasts with what-if questions, and weigh the qualitative factors before deciding.
Section 14: The mindmap
How a business judges whether an investment is worth its cost, with the payback period and the average rate of return and, for HL, net present value, and what the numbers leave out.
Drag to move the map, or use the arrow keys. Click a branch to fold it away. Whole map shows all of it; zoom with the buttons, or with Ctrl and the scroll wheel.
- Core ideas
- Calculations
- Evaluation
- Advantage
- Limitation
- HL HL only
The map as an outline
Appraising an investment
Core ideas
- Definition Is a project worth its cost?
- Capital cost now, net returns later Returns are the net cash flows the project brings in each year.
- Accept, reject or rank projects
- Limitation Rests on forecasts of future returns The further ahead the forecast, the less reliable it is.
Payback period
Calculations
- Formula Payback period Payback = years before the cost is recovered + (amount still to recover ÷ net cash flow in the payback year) × 12 months Not on the guide's formula sheet; assumes cash arrives evenly through the year.
- Track cumulative cash flow to find the year
- Advantage Quick and simple; favours a fast return of cash
- Limitation Ignores returns after payback
- Limitation Ignores the time value of money
Average rate of return
Calculations
- Formula Average rate of return (ARR) ARR = ((total returns − capital cost) ÷ years of use) ÷ capital cost × 100
- Compare with interest rates or a target
- Advantage Uses all the returns and shows profitability
- Limitation Ignores when the returns arrive
- Limitation Depends on long-range forecasts
Net present value HL
Calculations
- Later returns are discounted to today's value HL Money now is worth more than the same sum later.
- Formula Present value HL Present value = future return × discount factor
- Discount factors come from the table HL The guide's table covers 4% to 20% over years 1 to 10.
- Formula Net present value (NPV) HL NPV = ∑ present values of return − original cost
- Positive NPV: the project adds value HL
- Advantage Allows for the time value of money HL
- Limitation Depends on the discount rate chosen HL
Making the decision
Evaluation
- The methods can rank projects differently
- Money received later is worth less Payback and ARR ignore this; NPV (HL) allows for it.
- Qualitative factors
- Fit with objectives and strategy
- Effects on staff, ethics and the environment
- Brand image and risk
- Cost and availability of finance
Open the mindmap on its own page, with its terms and connections.
Section 15: More diagrams
Original diagrams from the platform's library, each with a text description and an SVG download.
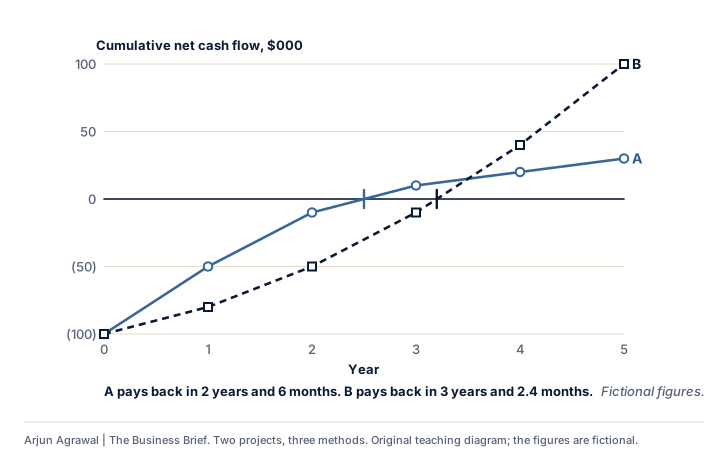
Change either project’s cost or yearly returns, or the discount rate; the chart and the table follow.
| Method | Project A | Project B | Prefers |
|---|---|---|---|
| Payback period | 2 years and 6 months | 3 years and 2.4 months | A |
| Average rate of return | 6.00% | 20.00% | B |
| NPV at 10% (HL) | $6.58k | $44.43k | B |
The methods disagree. Payback prefers A; the ARR and NPV prefer B. Payback rewards getting the money back soon; the ARR and NPV count every year's return, and NPV also counts when it arrives. The choice depends on what the business needs most: cash back quickly, or the larger return.
The figures above are the example’s. With JavaScript on, they can be changed here.
Text description
Two fictional projects. A, a delivery van, costs $100k and its cumulative net cash flow runs (100), (50), (10), 10, 20, 30; it pays back in 2 years and 6 months. B, an online shop, costs $100k and its cumulative net cash flow runs (100), (80), (50), (10), 40, 100; it pays back in 3 years and 2.4 months. Each line crosses zero where the project has repaid its cost.
Section 16: Key terms
Defined in the platform's own words. Each opens its full entry.
- Average rate of return (ARR)
- The average yearly net return from an investment, after its capital cost has been covered, as a percentage of that capital cost.
- Discount factor HL
- The number by which a future sum is multiplied to find its present value, which depends on the discount rate and on how many years away the sum is.
- Investment
- Spending money now on capital assets or projects, such as machinery, buildings, technology or research, in order to earn returns in the future.
- Investment appraisal
- Using quantitative methods (the payback period, the average rate of return and, for HL, net present value) to judge whether an investment project is worthwhile or which of several projects to choose.
- Net present value (NPV) HL
- The total present value of an investment's future returns, once each has been discounted, minus the project's original cost, which shows whether the project adds value in today's money.
- Payback period
- The time it takes for the net cash flows from an investment to add up to its capital cost, usually stated in years and months.
- Present value HL
- What a sum of money to be received in the future is worth today, found by multiplying it by the discount factor for its year and the chosen rate.
- Time value of money
- The idea that a sum of money received today is worth more than the same sum received in the future, because money held now can be invested to earn interest, and future money is less certain and can lose value to inflation.
Section 17: Tools and practice
6 tools on the platform for 3.8, by room, with exercises, worked calculations and practice questions.
Worked calculations
Section 18: Check your recall
Answer from memory, then reveal and rate yourself. Your ratings stay on this device.
Answer each question from memory, out loud or on paper, before you reveal the answer. Your ratings also schedule these questions in your flashcards.
-
What does the payback period measure, and what does the usual method assume?
How long a project takes for its net cash flows to add up to its capital cost. Working out the months assumes that each year's cash arrives evenly through the year.
How well did you recall it? -
A $60,000 machine returns $20,000, $25,000 and $30,000 in years 1 to 3. What is its payback period?
After two years $15,000 is still to recover. 15,000 ÷ 30,000 × 12 = 6 months, so payback is 2 years and 6 months.
How well did you recall it? -
A $50,000 project has total returns of $70,000 over four years. What is its ARR?
(70,000 − 50,000) ÷ 4 = $5,000 a year; 5,000 ÷ 50,000 × 100 = 10%.
How well did you recall it? -
Give two limitations of payback and one of ARR.
Payback ignores the returns after payback and the time value of money, so it says nothing about profitability. ARR ignores when the returns arrive, and relies on forecasts for every year of the project's life.
How well did you recall it? -
Why might a business choose the project with the shorter payback, even though its ARR is lower?
For example because it is short of cash, its market or technology changes quickly, or its owners are cautious, so getting the money back quickly matters more than the highest average return.
How well did you recall it? -
HL only. Why is the original cost not discounted in an NPV calculation?
It is paid at the start, so it is already in today's money. Only the future returns are discounted.
How well did you recall it? -
HL only. What does a negative NPV at a 10% discount rate tell a business?
The present value of the returns is less than the cost, so the project earns less than 10% a year and, on financial grounds, should be rejected at that rate.
How well did you recall it? -
Name four qualitative factors in an investment decision.
For example fit with the business's objectives, the effect on employees, ethical and environmental effects, the brand, the reliability of the forecasts, the availability of finance and competitors' reactions.
How well did you recall it?
Section 19: How it connects
Where 3.8 meets the rest of the course: worked connections with an exam-style question on each, then the further links the notes name.
-
With 3.1 Introduction to finance
Capital expenditure is appraised first
Capital expenditure buys assets that will be used for more than a year, such as machinery, vehicles or buildings, and it usually commits a large sum for a long time. That is why it is appraised before the money is spent: the payback period shows how quickly the cash comes back, the average rate of return compares the yearly return with the cost, and at HL net present value allows for the time value of money. Revenue expenditure, the day-to-day running costs, is not appraised in this way, because it is used up within the year.
Exam-style question Source: Original practice question Command term: Explain (AO2)
Explain why a business uses investment appraisal before making capital expenditure. [4 marks]
-
With 5.8 Research and development
Appraising research and development HL
Research and development is an investment, but an unusually hard one to appraise. The costs come first and are often large; the returns, if any, arrive years later and are uncertain, because a project can fail or be overtaken by a rival's innovation. The payback period may look long and the average rate of return low, and at HL net present value discounts the distant returns heavily. Yet a business that spends nothing on research and development risks being left with an ageing portfolio. Investment appraisal supplies the figures; the decision also rests on strategy and on how much risk the business can bear.
Exam-style question Source: Original practice question Command term: Discuss (AO3)
Discuss the difficulties of using investment appraisal to decide whether to fund a research and development project. [10 marks]
Also linked in the notes
- 1.3 Business objectives Objectives, ethics and corporate social responsibility shape the qualitative side of an investment decision.
- 1.5 Growth and evolution Internal growth usually means investment, so appraisal sits behind most decisions to grow.
- 3.2 Sources of finance A worthwhile project still has to be financed, and the interest rate on a loan is a benchmark its return must beat.
- 3.7 Cash flow Payback is about cash. A project can be profitable over its life and still strain cash flow in its early years.
- 5.2 Operations methods The investment needed for a new line or a configurator should be appraised before it is made, as Ashgrove's payback periods show.
- 5.4 Location The cost of a new site is capital expenditure, to be appraised with payback, the average rate of return and, at HL, net present value.
See 3.8 on the course connections map, with every link drawn across the five units.
Section 20: Connected learning
Everything else on the platform that teaches, applies or tests 3.8, each labelled by its standing.
- Revise
-
- The 3.8 mindmap Full and revision views, to print or download
- Revision sheet The subtopic on one printable page
- Flashcards The 3.8 cards, to rate as you go
- Practise
-
- 11 questions on 3.8 in the question bank From the practice sets, the notes and the case files, filtered to this subtopic
- Cases
-
- Quintanilla Autopartes Fictional Case Vault
- Decisions and simulations
-
- Kilbrack Bakery: machines, people and the price of bread Fictional Boardroom simulation
- Hotel Mareluce: full rooms or a future Fictional Boardroom simulation
- Corvell Furniture: three years to restore the margin Fictional Boardroom simulation
- Tools
-
- 6 tools for 3.8 In Tools and practice on this page: Finance Desk, Financial Laboratory, Entrepreneurship and Innovation Lab, Advanced financial analysis
- Boardroom Briefings
-
- Hartwell & Rye weighs its first step into Japan Fictional Briefing 1
- Quarrystone Climbing is offered its closest rival Fictional Briefing 2
- Tasman Loaf Company weighs robots for its packing hall Fictional Briefing 4
- Tallowood Cafés is offered the roaster behind its coffee Fictional Briefing 8
- Velmar Components weighs a buyback against a factory for electric cars Fictional Briefing 9
- Business Intelligence
-
- Kroger closes three automated warehouses built with Ocado and expects about $2.6 billion of charges Real-world A real development, 18 November 2025, with its sources
- Advanced Management
-
- Corporate strategy and restructuring Enrichment Advanced strategy: beyond the IB course
- Mergers, acquisitions and strategic alliances Enrichment Advanced strategy: beyond the IB course
- Capital budgeting and investment decisions Enrichment Advanced financial management: beyond the IB course
- Risk, return, the cost of capital and capital structure Enrichment Advanced financial management: beyond the IB course
- Valuation fundamentals Enrichment Advanced financial management: beyond the IB course
- Sensitivity analysis and scenario planning Enrichment Advanced financial management: beyond the IB course
- Capacity planning, quality management and technology adoption Enrichment Operations and supply chain strategy: beyond the IB course
- Unit economics and entrepreneurial finance Enrichment Entrepreneurship and innovation: beyond the IB course
- Course connections
-
- 2 worked connections on the connections map With 3.1, 5.8
Notes checked against: Business management guide, first assessment 2024 (published February 2022, updated May 2022), pp. 30, 65 and 66 (The content statement and its assessment objectives; the ARR and NPV formulas; the discount table). Updated 2026-11-03. The IB guide is the authority on the course.
Arjun Agrawal | The Business Brief, https://the-business-brief-dun.vercel.app/topics/investment-appraisal/. Original teaching material, not an IB publication. The organizations in the teaching cases are fictional unless a case says otherwise.