Unit 5: Operations management
5.1 Introduction to operations management
Study mode could not start. The page reads as usual.
Study mode
On this page
Section 01: What the IB course asks
The content statements for 5.1, in the platform's words, with the depth of teaching the guide sets (guide, from p. 33).
- The role of operations management AO2
AO1 knowledge and understanding · AO2 application and analysis · AO3 synthesis and evaluation · AO4 a range of skills. A question can use a command term at its statement's level or below. The whole course.
Section 02: Why it matters
Every business makes something, whether it is a car, a haircut, a loan or a loaf of bread, and operations management is the function that makes it happen. It is where most of a business's costs are incurred and most of its promises to customers are kept or broken, so a business with a brilliant product and a clever campaign still fails if it cannot make and deliver what it sells, well and on time.
This subtopic sets out the role of operations management (AO2): the transformation of inputs into outputs, the difference between producing goods and services, what operations aims for, the decisions it makes, and how it depends on the other business functions and on sustainable, ethical practice. The rest of unit 5 studies its decisions one at a time.
By the end you can
- Explain the role of operations management in transforming inputs into outputs and adding value.
- Distinguish between operations that produce goods and operations that produce services.
- Explain the objectives of operations management, the trade-offs between them, and how output and waste change unit cost.
- Analyse how operations decisions affect, and depend on, marketing, finance and human resources.
- Explain how sustainable and ethical practices, including circular business models, shape operations.
- Apply simple measures of operations performance, such as on-time delivery and waste rates, and comment on what they show.
- Explain how a creative production process can change a market.
Section 03: What operations management is
Operations management is the business function that plans, runs and improves the processes that turn inputs into the goods and services a business sells. Every organization has an operations function, whether or not it uses the name. In a factory it runs the production line; in a hospital it runs the wards and operating theatres; in a bank it processes payments and loans; in a bakery it turns flour, water and the bakers' skill into bread on the shelf by 7 a.m.
Its role is easiest to see in the transformation process (1.1). Inputs come in: materials, labour, equipment and buildings, energy and information. The process transforms them by making, assembling, moving, storing or serving. Outputs go out: the goods and services customers want. Operations management decides how the transformation happens and makes sure it happens well, with the right products, of the right quality, in the right quantity, at the right time and at an acceptable cost.
The transformation should add value: customers should value the output more than the inputs cost. Operations is where most of a business's costs arise, which is why small improvements in operations can have a large effect on profit and on customers' loyalty. The guide's first conceptual understanding for unit 5 makes the point from another angle: change in operations affects the business's other activities (p. 33).
- Inputs
The factors of production, namely land and materials, labour, capital such as machinery and buildings, and enterprise, together with energy and information.
- Processes
The activities that transform the inputs, such as making, assembling, mixing, moving, storing and checking, and in services, serving the customer directly.
- Outputs
The goods and services sold to customers, and also unwanted outputs such as waste, emissions and noise, which operations must manage too.
- Added value
The difference between what customers pay for the output and the cost of the materials and services bought in to make it. Operations creates value by turning inputs into something worth more, and destroys it through waste, delays and faults.
- Efficiency and effectiveness
Efficiency is producing an output with as few resources as possible; effectiveness is producing the right output, one that meets customers' needs. An operation can be very efficient at making something customers do not want.
Text description
Four inputs, the factors of production, flow into the business: land, meaning natural resources; labour, human effort; capital, such as machinery and buildings; and enterprise, the initiative and risk-taking that combines them. Inside the business, the four functions, human resources, finance and accounts, marketing and operations, carry out the transformation process. The output is goods and services sold to customers. Added value is the selling price minus the cost of bought-in materials and services.
Section 04: Operations for goods and for services
Operations management applies to services as much as to goods, but services raise problems of their own. A good is tangible: it can be made in advance, stored, checked before the customer sees it and transported. A service is intangible: it is usually produced at the moment it is consumed, often with the customer present, so it cannot be stored, inspected before delivery or easily standardized. A hotel room left empty tonight is revenue lost for ever; a car not sold today can still be sold next month.
These differences change what operations managers do. A manufacturer can smooth production by building stock in quiet months; a service business must match its capacity to demand hour by hour, through rotas, appointments and prices that change with demand. A manufacturer controls quality mainly inside its factory; a service business depends on the behaviour of its front-line staff at the moment of service, which is why the marketing mix for services adds people, processes and physical evidence (4.5).
Most products sit between the two. A restaurant sells food, a good, together with the service of cooking and serving it; a car maker sells finance, servicing and warranties as well as cars; a software company's product is code, delivered as a service. The four sectors of 1.1 give the same picture: primary and secondary operations are mostly about goods, tertiary and quaternary operations mostly about services, and most businesses now combine both.
- Tangibility
Goods can be seen and touched before they are bought; services cannot, so customers judge them by cues such as staff, premises and reviews.
- Storability
Goods can be held as stock; most services perish if they are not used at the moment they are offered, such as an empty seat on a flight.
- Customer involvement
Goods are usually made away from the customer; many services are produced with the customer present, so the customer becomes part of the process.
- Standardization
Goods can be made identically by machines; services vary with the person delivering them and the customer receiving them.
- Correcting faults
A faulty good can be caught before it leaves the factory; a poor service is experienced before anyone can put it right.
Section 05: What operations aims for
Operations managers judge their work against a small set of objectives. The guide does not list them, but operations textbooks commonly describe five, set out below: cost, quality, speed, dependability and flexibility. Sustainability, one of the course's four key concepts, is increasingly treated as a sixth. Together they describe what customers and owners expect from the way a business makes and delivers its products.
The objectives pull against each other, so no operation can be best at all of them. Making a wide range of products (flexibility) usually costs more per unit than making one product in volume; promising delivery within the hour (speed) means keeping spare staff and stock, which raises cost; checking every item (quality) slows production down. Operations management is therefore a matter of choosing which objectives matter most to the business's customers and strategy, and accepting a cost on the others. A budget airline and a private jet company both fly passengers, but they rank these objectives in almost opposite orders.
Efficiency links several of them. An efficient operation produces its output with few resources: little waste of materials, little idle time for staff and machines, and a low unit cost, the average cost of producing one unit. Unit cost falls when fixed costs are spread over more output and when less is wasted, which is why capacity, waste and the production method (5.2) matter so much.
- Cost
Producing at a low cost per unit, which allows lower prices or higher margins. It depends on efficiency, scale and waste.
- Quality
Meeting customers' expectations consistently, every time. A fault that reaches a customer costs far more, in refunds and reputation, than one prevented in the process.
- Speed
How quickly a customer receives the product after asking for it.
- Dependability
Delivering when promised. For a café that opens at 7 a.m., bread that arrives at 7.30 is a failure, however good it is.
- Flexibility
The ability to change what is produced, how much or when, such as handling a rush order or adding a new product, without large extra costs.
- Capacity utilization HL
At HL, subtopic 5.6 measures how fully an operation uses what it could produce, with the guide's formula (p. 65), capacity utilization rate = actual output ÷ productive capacity × 100. Copperleaf's ovens can bake 3,000 loaves a day, so at 2,400 loaves they run at 2,400 ÷ 3,000 × 100 = 80% of capacity.
HL This section has HL-only points, hidden while you are viewing SL content.
Unit cost (average cost)
Unit cost = total costs ÷ output
Total costs are fixed costs plus variable costs (3.3). A standard form; the guide's formula list does not include it.
Section 06: Measuring how well operations performs
An operation cannot be improved unless its performance is measured. Each objective has its own measures, usually expressed as a percentage or a rate so that one period can be compared with another, and one site with another.
- Cost: unit cost, total costs ÷ output.
- Quality: the share of output that is faulty, returned or complained about.
- Dependability: the share of orders delivered on time and in full.
- Speed: the time from a customer's order to its delivery.
- Flexibility: how quickly the operation can change what it makes, or how much.
- Sustainability: the waste, energy and emissions for each unit produced.
Two cautions apply. First, people manage what is measured, so a single measure can distort behaviour: a bakery judged only on cost may bake too little and leave its cafés short. Second, a figure means little on its own; it needs a comparison with a target, with past periods or with rivals. The toolkit's descriptive statistics help here (p. 14), because the mean, the median and the spread of a fortnight's results say more than one day's figure. At HL, subtopic 5.6 adds the guide's measures of capacity utilization, productivity and the defect rate.
- On-time delivery rate
Deliveries made on time as a percentage of all deliveries, a common measure of dependability.
- Waste rate
Units wasted as a percentage of units produced, a measure of efficiency and of sustainability at once.
- Mean and median
The mean shares the total equally among the values; the median is the middle value once they are put in order. One unusually bad day pulls the mean up but barely moves the median, as the toolkit's descriptive statistics show.
- Productivity and the defect rate (5.6) HL
At HL, labour productivity is the output per worker or per hour, the guide's productivity rate is total output ÷ total input × 100 (p. 65), and the defect rate is the percentage of units that fail the required standard.
HL This section has HL-only points, hidden while you are viewing SL content.
Text description
A dot plot of 11 weeks of fictional sales: 12, 15, 15, 18, 20, 21, 23, 26, 28, 31, 42 units. Above it, a box runs from the lower quartile, 15, to the upper quartile, 28, with the median, 21, marked inside. The mean is 22.82, pulled above the median by the one high week of 42. The mode is 15. The interquartile range is 13, the range is 30, and the standard deviation is 8.23. Quartiles here are the medians of the lower and upper halves; other methods give slightly different values.
On-time delivery rate
On-time delivery rate = deliveries made on time ÷ total deliveries × 100
A standard measure, not on the guide's formula list.
Waste rate
Waste rate = units wasted ÷ units produced × 100
A standard measure, not on the guide's formula list.
Advantages
- Shows where an operation is falling short, and whether a change has worked.
- Allows comparison between periods, sites and rivals.
- Gives staff clear targets to work towards.
Limitations
- People manage what is measured, so a single measure can distort behaviour.
- Some objectives, such as flexibility or the quality of a service, are hard to measure.
- Collecting and checking the data takes time and money.
- Averages can hide bad days, which is why the spread matters as well as the mean.
Section 07: The decisions operations managers make
The role of operations management is clearest in the decisions it takes. Some are long-term and expensive to reverse: which production method to use, how much capacity to build and where to locate. Others are made every day: how much to make, in what order, with which staff, and how to keep quality up and costs down. Most of the rest of unit 5 studies these decisions one by one.
Each decision shapes the objectives in the previous section. A larger kitchen adds capacity but raises fixed costs; a cheaper location may lengthen deliveries; buying a part instead of making it may save money but gives up control of its quality. Good operations decisions start from what the business's customers value most and what its strategy needs, not from what looks cheapest in isolation.
- Design of the product and the process
What exactly will be made or offered, and the sequence of steps that produces it. Good design makes a product easy to make well, first time.
- Operations method (5.2)
Job, batch or mass production, or mass customization, depending on the volume and variety of output.
- Location and make or buy (5.4)
Where to produce, which activities to keep in-house and which to buy from other firms, and whether to reorganize production by outsourcing, offshoring, insourcing or reshoring.
- Technology and layout
Which equipment to use, how far to automate, and how to arrange the workplace so that work flows without delays or wasted movement.
- Capacity, stock and the supply chain (5.6) HL
At HL, how much the operation can produce, how much stock to hold, and how materials flow from suppliers to customers, locally and globally.
- Lean production and quality (5.3) HL
At HL, cutting waste through continuous improvement and just-in-time, and managing quality through quality control, quality assurance and total quality management.
- Planning projects (HL toolkit) HL
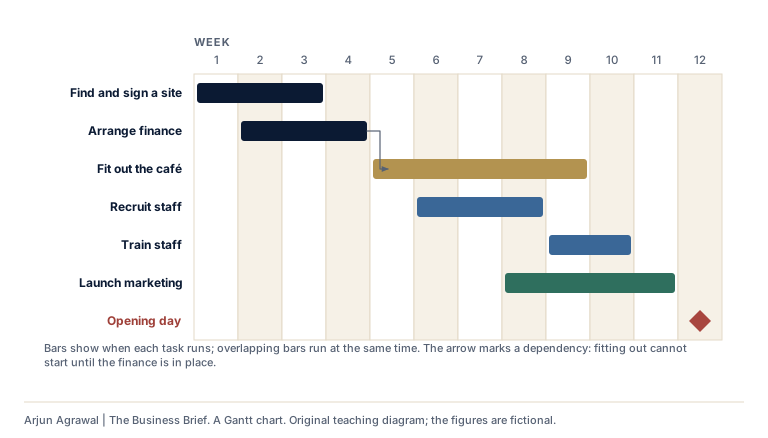
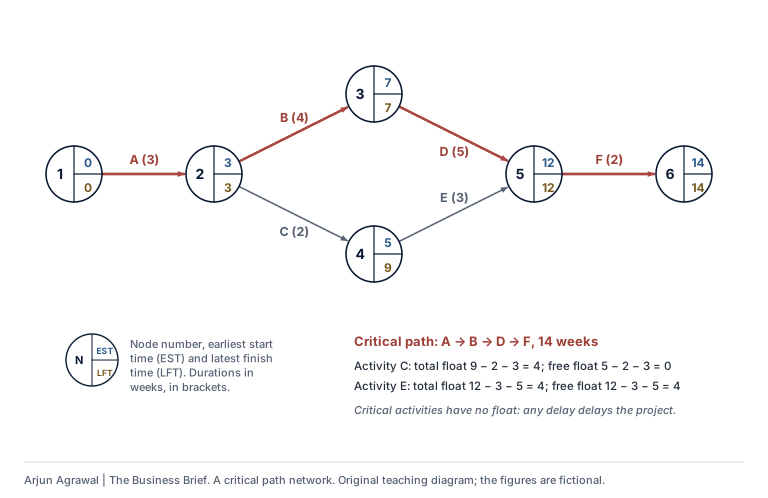
Gantt charts and critical path analysis, HL tools the guide suggests for unit 5 (p. 33), schedule the activities of a project and show which delays would hold up the whole.
- Risk, innovation and information (5.7 to 5.9) HL
At HL, preparing for crises through contingency planning, developing new products and processes through research and development, and using management information systems and data to decide.
HL This section has HL-only points, hidden while you are viewing SL content.
Section 08: Operations and the other business functions
Operations cannot work alone. Marketing tells it what to make, how much and by when, through research, sales forecasts and the promises made in the marketing mix, and operations decides whether those promises can be kept. Finance and accounts funds equipment, stock and buildings, sets budgets, and counts the costs that operations creates, which then shape prices and profit. Human resources recruits, trains and motivates the people the production method needs, in the right numbers and with the right skills, and plans their shifts (2.1).
The functions often want different things. Marketing wants variety and fast delivery to please customers; operations wants long, steady runs of standard products to keep costs down. Finance wants little money tied up in stock; operations wants a buffer in case a delivery is late. HR must find people willing to work the hours that production needs. None of these wishes is wrong, but they cannot all be met, so good management settles the conflicts through planning and communication, and makes the trade-offs deliberately rather than by accident.
This is why an operations decision is never only an operations decision, and why an examination answer about one should follow its consequences into the other functions and out to the stakeholders.
- Marketing and operations
Forecasts and the marketing mix set volumes, features and delivery promises; in return, operations' costs, capacity and quality limit what marketing can promise and the prices it can charge.
- Finance and operations
Finance funds the equipment and stock that operations needs and judges investments in them (3.8); operations' efficiency largely determines the business's costs and profit margins.
- Human resources and operations
The production method decides how many people are needed, with what skills and on which shifts; recruitment, training and motivation decide how well the work is done.
- Shared information
Each function needs the others' plans. A sales campaign that operations was not told about, or a machine breakdown that marketing did not hear of, ends in disappointed customers.
Section 09: Creative operations: when a new process changes the market
One of the guide's conceptual understandings for unit 5 is that a creative production process can disrupt the market (p. 33). Operations is usually discussed as doing the same thing more efficiently, but some of the most important changes in business come from doing it differently: a new way of making, delivering or serving that lets a business offer something its rivals cannot easily match.
A creative process can cut costs so far that a product reaches customers who could not afford it before, or it can change what customers expect, such as delivery the next morning, a product designed by the customer or a service available at any hour. Established businesses often find such changes hard to follow, because their factories, skills, suppliers and habits were built for the old process, a form of the industrial inertia met in 5.4.
Creativity in operations does not need a laboratory. It often comes from the people who do the work, through suggestion schemes and small trials, and from looking at how other industries solve a similar problem.
- New ways of making
Changing how a product is made, through flat-packing, modular parts, 3D printing or automation, can cut costs or make new products possible.
- New ways of delivering
Changing how a product reaches customers, by selling direct online, delivering from a few central warehouses or letting customers serve themselves.
- New ways of serving
Redesigning a service around the customer, with online booking, self-service or appointments at times that suit, often using data and technology.
- Incremental and disruptive innovation (5.8) HL
At HL, innovation that improves an existing process step by step is incremental; innovation that transforms a market, often starting with a simpler, cheaper offer that established businesses overlook, is disruptive.
HL This section has HL-only points, hidden while you are viewing SL content.
Advantages
- It can cut costs or offer something rivals cannot easily copy, because it rests on know-how rather than on a feature that is simple to imitate.
- It can open new markets, as lower costs or faster delivery reach customers who were not served before.
- Ideas from the people who do the work are often cheap to try.
Limitations
- New processes need investment and may not work at full scale.
- Change disrupts staff, suppliers and customers used to the old way.
- Rivals may copy the process in time, so the advantage may not last.
Section 10: Sustainable and ethical operations
Sustainability is one of the course's four key concepts, and the guide describes it through the triple bottom line of people, planet and profit (p. 13). Operations is where most of a business's effect on the environment arises, from the materials and energy it uses to the waste and emissions it produces. The guide's conceptual understandings for unit 5 put the link directly: sustainability ensures efficiency in business operations, and operational changes may affect a business's ethical stance (p. 33).
Sustainability and efficiency often point the same way. Using less energy, wasting fewer materials and keeping products in use for longer cut costs as well as harm to the environment. The toolkit's circular business models, the five shown in the diagram, are ways of designing waste out of operations instead of following a pattern of take, make, use and throw away. But not every sustainable choice saves money. Recycled materials, cleaner energy and fair pay for suppliers' workers can all cost more, at least at first, so the business must decide how far to go and how to explain its choices honestly.
Ethics runs through operations as well: the safety and working conditions of employees, the treatment of the workers who make a supplier's goods, honesty about what a product contains, and the effect of a site on its neighbours. Switching to a supplier with poor labour standards may look efficient, but it changes the business's ethical stance, and the damage to its reputation when the truth comes out can cost far more than was saved.
- Circular supply models
Using inputs that can be regrown, composted or recycled, such as plant-based materials or recycled metal, instead of new raw materials.
- Resource recovery models
Collecting used products, scraps and by-products and turning them into materials or energy that can be used again.
- Product life extension models
Keeping products in use for longer through durable design, repair, maintenance, upgrading and resale.
- Sharing models
Letting many people use one item by renting, borrowing or sharing it, often arranged through an app.
- Product service system models
Selling the use or performance of a product, by leasing or paying per use, while the business keeps ownership and so has a reason to make it last.
Text description
The five circular business models the guide names, around a loop that keeps resources in use. Circular supply: inputs that can be regrown, composted or recycled. Resource recovery: value captured from waste, scraps and by-products. Product life extension: durable design, repair, upgrade and resale. Sharing: many users share one item, often through an app. Product service system: customers pay for use while the business keeps ownership.
Advantages
- Less waste and energy lower costs as well as harm to the environment.
- A genuine record on sustainability and ethics strengthens the brand and customers' loyalty.
- It helps to recruit and keep employees who care about how the business behaves.
- It reduces exposure to rising prices of scarce materials and to tighter regulation.
Limitations
- Sustainable materials, equipment and fair pay for suppliers' workers can cost more, at least at first.
- Benefits such as reputation are hard to measure, while the costs are immediate.
- Claims that operations do not support are greenwashing, and they destroy trust when exposed.
- Price-sensitive customers may not pay more for a more sustainable product.
Section 11: In practice: industries and stakeholders
The same ideas look different from one industry to the next, and land differently on each group with a stake in the business.
Across industries
- Manufacturing
Operations is most visible here, in production lines, stock and quality checks. Unit cost and dependability dominate, and the production method (5.2) and the location (5.4) are the decisions with the longest consequences.
- Hospitality
The service is produced in front of the customer, so operations means matching staff to demand hour by hour, managing the flow of guests through check-in or a dining room, and keeping each visit as good as the last. Empty rooms and tables cannot be stored, which makes forecasting demand central.
- Healthcare
In a hospital, quality means safety, and dependability can be a matter of life and death. Operations managers plan the flow of patients through beds, theatres and clinics, where a bottleneck in one ward delays every other.
- Digital services
For a software or streaming business, operations means keeping servers running, releasing updates and protecting data. Serving one more customer costs very little, so the challenge is reliability and security at scale rather than the cost of each unit.
- Agriculture
In the primary sector, operations works with nature. Harvests depend on weather and seasons, produce is perishable, and land and water are finite, so sustainable practices, such as careful use of water and soil, are a condition of the business surviving at all.
- Retail and e-commerce
For an online retailer, operations is fulfilment, namely receiving and storing stock, picking and packing orders, delivering them and handling returns. Speed and dependability decide whether customers come back, and delivery to the door is often the most expensive stage, so warehouses are placed and run to make it fast and cheap.
- Public services
A city's waste collection, a passport office or a hospital clinic has no sales to count, so operations is judged by the cost per household or per case, by waiting times and by reliability. The public sets demand and budgets are fixed, so efficiency and dependability are what managers can control.
For each stakeholder
- Customers
Experience operations directly, as the price, quality and speed of what they buy. A business that cuts costs at the expense of quality or dependability loses them.
- Employees
Their jobs, hours and safety are shaped by operations decisions such as shifts, automation and the production method. Efficiency gains can mean pressure, unsocial hours or job losses, a conflict with owners who want lower costs.
- Owners and shareholders
Want operations to keep costs down and quality up, because both drive profit. Investment in equipment or in sustainability may reduce profit in the short term even when it raises it later.
- Suppliers
Depend on the business's schedules and payments. A business that squeezes their prices or changes orders at short notice gains in the short term but can lose reliable partners.
- Local community
Gains jobs and spending from a business's operations but bears their noise, traffic and pollution, so an expansion that pleases the owners can be opposed by the neighbours.
- Government and regulators
Set the rules operations must meet, on health and safety, food hygiene, product standards, working hours and emissions, and inspect to enforce them. Meeting the rules costs money, but breaking them can mean fines, closure and lasting damage to the business's reputation.
Section 12: Evaluation and limits
What to weigh before reaching a judgement.
- Operations is where promises are kept or broken. Most of a business's costs, and most of what customers experience, come from operations, so it is a source of competitive advantage that is harder to copy than a price or an advertisement.
- Efficiency is not the same as effectiveness. Cutting unit cost is worthwhile only if the output still meets customers' needs; an operation that is cheap but late or unreliable loses the customers it was meant to serve.
- Every operation trades its objectives off against each other. The right balance depends on what the business's customers value and on its strategy, so judge an operations decision against the business's own position, not against an ideal of being best at everything.
- Operations decisions ripple through the business. A change of method, shift pattern or location affects staff, finance and marketing, so a full analysis follows the consequences across functions and stakeholders.
- Sustainability and efficiency often align, but not always. Less waste and energy save money; ethical sourcing and cleaner materials can cost more. Judge each case on its evidence, and be wary of claims of sustainability that the operations do not support.
- In an examination, 5.1 is set at AO2. Explain and analyse the role of operations in the case's own business, with its own inputs, processes and outputs, rather than giving a general definition.
- What is measured gets managed, for better or worse. On-time delivery, waste and unit cost show where an operation is falling short, but a single measure can be gamed and an average can hide the bad days, so judge an operation by several measures and by their spread.
Section 13: Make the decision
Use the ideas on a business choice: weigh the options, decide, and say what would change your mind.
Decision brief · a fictional business
Copperleaf's growing pains
Copperleaf Bakery, a fictional business, bakes about 2,400 loaves a day: 1,300 for its three shops and 1,100 for 14 cafés, which pay $2.40 a loaf against $3.20 in the shops. Its ovens can bake about 3,000 loaves a day, but the morning rush means the last batches finish too late for the café vans, and three more cafés want to join next year.
Each loaf has a variable cost of $0.95, and the bakery's fixed costs are $1,560 a day, so a loaf costs $1.60 to bake at today's output. Hana has three proposals for the board.
How to weigh the options
Judge each option against the operations objectives and its effects on the other functions, not on cost alone.
Option A tackles capacity and dependability directly, keeps quality in Copperleaf's hands and makes room for the three new cafés. But it commits $85,000 of capital, which finance must raise, and a night shift that HR must recruit, pay and keep safe. At today's output the bakery would use less than half of its new capacity, so its fixed costs would rise faster than its output until demand grows.
Option B costs little and attacks waste and inconsistency, the causes that need no new money. Fewer changes between products raise efficiency, and baking to a forecast could cut waste from 8% towards 3%. The cost falls on marketing: customers who loved the products that disappear may go elsewhere, and the range is part of Copperleaf's appeal.
Option C solves the capacity problem at once, but at a price. Each café loaf baked in-house earns a contribution of $2.40 − $0.95 = $1.45; bought in at $1.45, it would earn only $0.95, so the café trade would contribute $550 a day less. Copperleaf's fixed costs would stay while its own output fell to 1,300 loaves, raising the unit cost of its shop bread from $1.60 to about $2.15. And the cafés would be selling another bakery's bread delivered in Copperleaf's van, a risk to quality, and an ethical one if they are not told.
A strong answer might start with B, because it is cheap and fixes the causes, and plan for A if café demand keeps growing, while saying what evidence would change the order, such as a firm forecast of café orders or the results of a month's trial with the narrower range.
Section 14: Exam-style practice
Original questions written by the platform in the style of the papers, with what a strong response does. They are not IB questions and the guidance is not an official markscheme.
-
Define the term operations management.
What a strong response does
A precise definition: the business function that plans, runs and improves the processes that turn inputs into the goods and services a business sells.
A full answer names both the transformation of inputs into outputs and the management of it. "Making products" alone is incomplete, because it leaves out services and the planning and control that the function provides.
-
Explain the role of operations management at Copperleaf Bakery.
What a strong response does
A strong answer applies the role to the bakery rather than defining it in general:
- Operations transforms inputs (flour, the bakers' labour, ovens, energy) into outputs (bread for the shops and cafés), adding value: a shop loaf sells for $3.20 against $0.62 of bought-in materials.
- It is responsible for doing this at the right quality, quantity, time and cost: consistent sourdough, enough loaves without waste, and deliveries before the cafés open.
- The case shows what happens when the role is done badly: late deliveries, inconsistent bread, 8% waste and rising overtime, all operations problems.
-
Distinguish between operations that produce goods and operations that produce services, with reference to Copperleaf Bakery.
What a strong response does
A strong answer sets out a clear difference and applies it to both sides of the bakery:
- Goods are tangible and can be made in advance, stored and checked before sale: Copperleaf bakes overnight and checks each batch.
- Services are intangible and produced as they are consumed, usually with the customer present, so they cannot be stored or checked in advance: the welcome in the shop and the delivery to each café happen once, in real time.
- A consequence for operations: goods can be stocked to smooth production, but services, and very perishable goods like bread, must match capacity to demand closely.
-
Copperleaf's fixed costs are $1,560 a day, and each loaf has a variable cost of $0.95.
Calculate the unit cost of a loaf when the bakery bakes (i) 2,400 loaves a day and (ii) 3,000 loaves a day.
What a strong response does
- (i) Total costs = $1,560 + (2,400 × $0.95) = $1,560 + $2,280 = $3,840. Unit cost = $3,840 ÷ 2,400 = $1.60.
- (ii) Total costs = $1,560 + (3,000 × $0.95) = $1,560 + $2,850 = $4,410. Unit cost = $4,410 ÷ 3,000 = $1.47.
Show total costs before dividing. The unit cost falls because the fixed costs are spread over more loaves: $0.65 a loaf at 2,400, but $0.52 at 3,000.
-
Analyse how a decision to add a night shift would affect Copperleaf's other business functions.
What a strong response does
A strong answer takes each function in turn and traces cause and effect, using the case:
- Human resources: three bakers must be recruited and trained; contracts, pay for unsocial hours and safety at night must be arranged; the night shift may also ease the overtime that is driving experienced bakers to resign.
- Finance: wages of about $96,000 a year, and the $85,000 oven if capacity is added, must be funded and budgeted; at today's output, fixed costs would rise faster than output.
- Marketing: earlier baking means café bread on time and fresh from 7 a.m., a promise Copperleaf could advertise, and room for the three new cafés.
- A conclusion on balance: for example, the shift helps marketing and may help retention, but only pays if café demand grows to use the extra capacity.
-
Copperleaf is considering buying its 1,100 café loaves a day from a contract bakery at $1.45 a loaf, instead of baking them. The cafés pay $2.40 a loaf, and a loaf baked in-house has a variable cost of $0.95.
Recommend whether Copperleaf should outsource its café orders.
What a strong response does
This question also draws on 5.4, where outsourcing is set at AO3. A strong answer weighs the option against the role of operations and reaches a justified recommendation:
- The figures: an in-house café loaf contributes $1.45; a bought-in one $0.95, so the café trade would contribute $550 a day less. Fixed costs of $1,560 would remain while output fell to 1,300, raising the unit cost of shop bread from $1.60 to about $2.15.
- For outsourcing: it frees capacity at once, ends the late deliveries and the overtime, and the contract bakery's scale may bring consistency.
- Against: a loss of contribution, a loss of control over quality and of Copperleaf's distinctive bread, dependence on one supplier, and an ethical question if cafés are not told whose bread they are selling.
- Alternatives: narrowing the range and baking to forecast, or a second oven and a night shift, may solve the problem while keeping the café trade's contribution.
- Judgement: for example, recommend against outsourcing now, because it gives away contribution and control to fix a problem that cheaper changes may solve; reconsider if café demand outgrows any realistic expansion. State what would change the decision.
-
Outline two objectives of operations management for a hospital.
What a strong response does
A strong response states two objectives and gives the key feature of each for a hospital, in a sentence or two.
- Quality: treatment that meets the expected standard every time, which in a hospital means patients' safety.
- Dependability: operations and appointments that happen when promised, because a cancelled operation harms the patient and wastes the theatre's time.
- Other valid objectives include speed (short waiting times), cost (treating patients within the budget) and flexibility (coping with a sudden rise in emergencies).
One mark for each objective and one for applying it to a hospital.
-
Over the last 50 delivery days, Copperleaf Bakery made 700 deliveries to cafés, of which 567 arrived on time. Six months ago, 672 of 700 arrived on time.
Comment on Copperleaf's dependability.
What a strong response does
A strong response turns the figures into rates, then judges them.
- The rates: 567 ÷ 700 × 100 = 81% now, against 672 ÷ 700 × 100 = 96% six months ago; late deliveries rose from 28 to 133.
- Judgement: dependability has fallen sharply. For cafés that open at 7 a.m., a late delivery is a failure however good the bread, and two cafés have already complained, so Copperleaf risks losing its café trade.
- Context: the fall coincides with output outgrowing the kitchen, which suggests a capacity problem rather than a careless one, so more pressure on the drivers would not fix it.
- A top response notes what else is needed, such as a target or the rate of rival bakeries, and the spread of late deliveries from day to day.
-
Suggest two ways Copperleaf Bakery could reduce the 8% of its bread that is thrown away.
What a strong response does
A strong response puts forward two plausible measures, each with a reason that fits the case.
- Bake shop bread to a daily forecast of what each shop sells, instead of to habit, because waste comes from baking more than is sold.
- Take café orders the day before, so that the night's baking matches confirmed demand.
- Other valid suggestions include baking smaller batches later in the day for the shops, narrowing the range, or selling the day's surplus at a discount in the last hour.
Giving surplus bread away is a good use of it, but it does not reduce the waste baked in the first place.
-
Describe the transformation process at a restaurant.
What a strong response does
A strong response sets out the inputs, the process and the outputs with detail specific to a restaurant.
- Inputs: ingredients, chefs and waiting staff, the kitchen and its equipment, energy, the dining room and the restaurant's recipes and booking information.
- Process: preparing and cooking dishes to order, serving them, taking payment and clearing and cleaning.
- Outputs: meals and the experience of eating out, which customers value more than the inputs cost, as well as unwanted outputs such as food waste.
A list of inputs with no description of how they are transformed earns at most half the marks.
Section 15: Revision summary
The subtopic on one page: what to remember.
- Operations management plans, runs and improves the processes that turn inputs into goods and services.
- Inputs, the factors of production, are transformed into outputs; operations should add value, and it must also manage unwanted outputs such as waste.
- Goods can be stored and checked before sale; services are usually produced as they are consumed, often with the customer present.
- Operations aims for low cost, quality, speed, dependability and flexibility, and increasingly sustainability. The objectives conflict, so each business chooses which matter most.
- Unit cost = total costs ÷ output. It falls as fixed costs are spread over more output and as waste is cut.
- Operations makes long-term decisions (method, capacity, location, make or buy) and daily ones (scheduling, quality, stock).
- Operations depends on marketing, finance and human resources, and a change in operations affects them all.
- Sustainable and ethical operations, including circular business models, can cut costs and protect reputation, though some choices cost more.
- Measure each objective, for example with an on-time delivery rate, a waste rate and unit cost; compare the results with targets, past periods or rivals; and look at the spread as well as the average.
- A creative production process can disrupt a market, as a new way of making, delivering or serving lets a business offer what its rivals cannot easily match.
Section 16: The mindmap
What operations management does, what it aims for, how it works with marketing, finance and HR, and the trade-offs behind its decisions.
Drag to move the map, or use the arrow keys. Click a branch to fold it away. Whole map shows all of it; zoom with the buttons, or with Ctrl and the scroll wheel.
- Core ideas
- Types and forms
- Connections
- Applications
- Evaluation
- Advantage
- Limitation
- HL HL only
The map as an outline
What operations does
Core ideas
- Definition Turning inputs into outputs Operations management plans, runs and improves the process that turns inputs into goods and services.
- Inputs: materials, labour, equipment, data
- Process: make, assemble, serve
- Outputs: goods and services for customers
- Adds value at every stage Customers pay more for the output than the inputs cost.
- Services, not just factories In a service, production and consumption often happen together, in front of the customer.
- Where most costs arise Small gains in efficiency or quality can have a large effect on profit.
Goods and services
Types and forms
- Goods: tangible, storable
- Services: intangible, made as consumed
- Example Most products mix the two A restaurant sells food, a good, together with table service.
Goals of operations
Core ideas
- Efficiency: low unit cost
- Quality: meets expectations Judged by what customers expect, not only by an absence of faults.
- Speed and dependability Delivering quickly, and when promised.
- Flexibility to change output Changing volumes or products without large extra costs.
- Sustainability: less waste and pollution Using resources efficiently supports environmental sustainability.
Links to functions
Connections
- Marketing: what and how much Forecasts and the marketing mix set volumes, features and delivery promises.
- Finance: budgets, investment Equipment needs capital; production costs shape prices and profit.
- HR: skills, numbers, shifts The production method decides how many workers are needed, with what training.
- Operations sets cost, quality and capacity
Key decisions
Applications
- Production method (5.2)
- Location of production (5.4)
- In-house or outsourced (5.4) Outsourcing, offshoring, insourcing and reshoring are all in 5.4.
- Break-even output (5.5)
Evaluating operations
Evaluation
- Trade-offs between goals Improving one goal, such as speed, often costs another, such as unit cost.
- Advantage Good operations is a competitive edge Reliable, low-cost delivery is hard for rivals to copy.
- Advantage Technology raises productivity More output from the same inputs lowers the cost of each unit.
- Limitation Efficiency can cost jobs Automation lowers cost but may meet resistance to change.
- Ethics: suppliers, staff, environment Operational choices affect a business's ethical stance.
Open the mindmap on its own page, with its terms and connections.
Section 17: More diagrams
Original diagrams from the platform's library, each with a text description and an SVG download.
Text description
A Gantt chart for opening a fictional café over 12 weeks. Find and sign a site: weeks 1 to 3. Arrange finance: weeks 2 to 4. Fit out the café: weeks 5 to 9. Recruit staff: weeks 6 to 8. Train staff: weeks 9 to 10. Launch marketing: weeks 8 to 11. Opening day is a milestone in week 12. Overlapping bars run at the same time, and an arrow shows that fitting out cannot start until the finance is in place.
Text description
A network of six activities between six nodes, each node showing its number, earliest start time and latest finish time. Activity A, 3 weeks, runs from node 1 to node 2; Activity B, 4 weeks, runs from node 2 to node 3; Activity C, 2 weeks, runs from node 2 to node 4; Activity D, 5 weeks, runs from node 3 to node 5; Activity E, 3 weeks, runs from node 4 to node 5; Activity F, 2 weeks, runs from node 5 to node 6. The critical path is A, B, D, F, taking 14 weeks; its activities have no float. Activity C has a total float of 4 weeks and a free float of 0. Activity E has a total float of 4 weeks and a free float of 4.
Section 18: Key terms
Defined in the platform's own words. Each opens its full entry.
- Added value
- The difference between the price a business receives for its output and the cost of the materials and services it bought in to make it.
- Average cost
- Total cost divided by the number of units produced.
- Circular business models
- Ways of organizing a business so that products and materials stay in use for as long as possible and waste is designed out, instead of following a take, make, use and throw away pattern.
- Effectiveness
- Producing the right output: goods and services that meet customers' needs and help the organization reach its objectives.
- Efficiency
- Producing a given output with as few resources as possible, or getting as much output as possible from the resources used.
- Goods and services
- The two kinds of output a business provides. Goods are physical products that can be stored and owned, such as shoes; services are intangible activities carried out for a customer, such as a haircut.
- Operations management
- The business function that designs, runs and improves the processes that turn inputs, such as materials, labour, equipment and information, into the goods and services a business sells.
- Quality
- How well a good or service meets the needs and expectations of its customers, consistently, every time it is supplied.
- Transformation process
- The sequence of activities through which a business changes its inputs, the factors of production, into outputs of goods and services that customers value more highly than the inputs themselves.
Section 19: Tools and practice
2 tools on the platform for 5.1, by room, with exercises, worked calculations and practice questions.
Operations Floor
- Production methods exercise
- Capacity utilization and productivity calculator HL Measure how well an operation turns inputs into outputs; capacity utilization and productivity are among the figures operations management is judged by (HL).
Practice questions with mark schemes
Section 20: Check your recall
Answer from memory, then reveal and rate yourself. Your ratings stay on this device.
Answer each question from memory, out loud or on paper, before you reveal the answer. Your ratings also schedule these questions in your flashcards.
-
What is operations management?
The business function that plans, runs and improves the processes that turn inputs into the goods and services a business sells.
How well did you recall it? -
Name the three stages of the transformation process, with an example of each for a bakery.
Inputs, such as flour, bakers and ovens; the process, mixing, proving and baking; and outputs, loaves sold to customers (and waste, which must be managed too).
How well did you recall it? -
Give two differences between operations for goods and for services.
For example, goods can be stored and services usually cannot; goods can be checked before the customer sees them, while services are experienced as they are produced; services often involve the customer directly and vary more from one occasion to the next.
How well did you recall it? -
Name the five operations objectives that textbooks commonly describe.
Cost, quality, speed, dependability and flexibility, with sustainability increasingly added as a sixth.
How well did you recall it? -
Why can an operation not be the best at all of its objectives at once?
They conflict. Flexibility and speed usually raise cost, and checking every item for quality slows production, so a business must choose which objectives matter most to its customers.
How well did you recall it? -
Fixed costs are $2,000 a day, the variable cost is $3 a unit, and output is 500 units. What is the unit cost?
($2,000 + 500 × $3) ÷ 500 = $3,500 ÷ 500 = $7, which is $4 of fixed costs plus $3 of variable cost a unit.
How well did you recall it? -
What is the difference between efficiency and effectiveness?
Efficiency is producing with as few resources as possible; effectiveness is producing the right output, one that meets customers' needs.
How well did you recall it? -
Give one way operations depends on marketing, and one way marketing depends on operations.
Operations depends on marketing's forecasts to know how much to make; marketing depends on operations to keep the promises it makes, such as quality and delivery times.
How well did you recall it? -
Name the five circular business models in the toolkit.
Circular supply, resource recovery, product life extension, sharing, and product service system models.
How well did you recall it? -
Why can sustainable operations lower costs?
Using less energy and fewer materials, wasting less and keeping products in use for longer all save money as well as reducing harm to the environment.
How well did you recall it? -
(HL) Ovens can bake 3,000 loaves a day and bake 2,400. What is the capacity utilization rate?
2,400 ÷ 3,000 × 100 = 80%.
How well did you recall it? -
How is an on-time delivery rate calculated?
Deliveries made on time ÷ total deliveries × 100.
How well did you recall it? -
Late deliveries on five days were 1, 2, 2, 3 and 12. Give the mean and the median, and say which better describes a typical day.
The mean is 20 ÷ 5 = 4 and the median is 2. The median better describes a typical day, because the one bad day pulls the mean up.
How well did you recall it? -
What does it mean for a creative production process to disrupt a market?
A new way of making, delivering or serving lets a business offer something rivals cannot easily match, such as much lower prices or faster delivery, and established firms built for the old process struggle to follow.
How well did you recall it?
Section 21: How it connects
Where 5.1 meets the rest of the course: worked connections with an exam-style question on each, then the further links the notes name.
-
Adding value through operations
A business takes inputs, such as materials, labour and equipment, and turns them into outputs that customers value more than the inputs cost; the difference is added value. Operations management runs that transformation day to day, deciding how much to produce, how, where and to what standard, so it settles much of the business's costs and the quality its customers receive. The sector shapes the work: in the secondary sector the transformation is manufacturing or construction, while in the tertiary sector it is a service, often delivered with the customer present.
Exam-style question Source: Original practice question Command term: Explain (AO2)
Explain the role of operations management in adding value for a business in the secondary sector. [4 marks]
-
With 5.3 Lean production and quality management
Operations and quality management HL
Operations management turns inputs into goods and services, and quality is one of the main standards it is judged by, alongside cost, speed and flexibility. Quality control inspects output to find defects after they are made; quality assurance builds checks into every stage so that fewer defects are made in the first place. Total quality management goes further and makes quality every employee's responsibility, supported by quality circles and by benchmarking against the best performers. Lean production joins the two ideas, because every defect is wasted material, time and labour.
Exam-style question Source: Original practice question Command term: Distinguish (AO2)
Distinguish between quality control and quality assurance in a food manufacturer. [4 marks]
Also linked in the notes
- 3.1 Introduction to finance Operations decisions about capacity, equipment and location create much of a business's capital expenditure, and most of its running costs.
- 3.3 Costs and revenues Operations decisions create most of a business's fixed and variable costs, and so its unit cost.
- 4.3 Sales forecasting At HL, sales forecasts tell operations how much to make; Copperleaf's waste came from baking to habit instead of to a forecast.
- 4.5 The seven Ps of the marketing mix For services, people, processes and physical evidence join the marketing mix, because the operation is part of what the customer buys.
- 5.2 Operations methods The production method is one of the first and longest-lasting operations decisions.
- 5.4 Location Where to produce, and whether to make or buy, are operations decisions with effects on cost, quality and ethics.
- 5.6 Production planning At HL, capacity, stock control and the supply chain measure and manage how much an operation can produce.
- 5.8 Research and development At HL, process innovation, incremental or disruptive, is how a creative production process changes a market.
See 5.1 on the course connections map, with every link drawn across the five units.
Section 22: Connected learning
Everything else on the platform that teaches, applies or tests 5.1, each labelled by its standing.
- Revise
-
- The 5.1 mindmap Full and revision views, to print or download
- Revision sheet The subtopic on one printable page
- Flashcards The 5.1 cards, to rate as you go
- Practise
-
- 11 questions on 5.1 in the question bank From the practice sets, the notes and the case files, filtered to this subtopic
- Decisions and simulations
-
- Corvell Furniture: three years to restore the margin Fictional Boardroom simulation
- Frameworks
-
- Critical path analysis IB toolkitHL
- Gantt charts IB toolkitHL
- The value chain Enrichment
- Tools
-
- 2 tools for 5.1 In Tools and practice on this page: Operations Floor
- Advanced Management
-
- Operations strategy, process optimization and lean systems Enrichment Operations and supply chain strategy: beyond the IB course
- Sustainable operations Enrichment Operations and supply chain strategy: beyond the IB course
- Course connections
-
- 2 worked connections on the connections map With 1.1, 5.3
Notes checked against: Business management guide, first assessment 2024 (published February 2022, updated May 2022), pp. 13 to 14, 33, 41 to 43, 64 to 65 (The content statement and its assessment objective, the unit's conceptual understandings, including that a creative production process can disrupt the market, and its suggested tools (p. 33); the key concept of sustainability, the toolkit's circular business models and descriptive statistics (pp. 13 to 14); the papers behind the practice questions (pp. 41 to 43); the capacity utilization and productivity rate formulas (p. 65)); Business management teacher support material, pp. 34 to 35 (The lesson plan on production, read to check the scope of the unit's introduction; nothing reproduced). Updated 2026-11-20. The IB guide is the authority on the course.
Arjun Agrawal | The Business Brief, https://the-business-brief-dun.vercel.app/topics/introduction-to-operations-management/. Original teaching material, not an IB publication. The organizations in the teaching cases are fictional unless a case says otherwise.