Unit 3: Finance and accounts
3.5 Profitability and liquidity ratio analysis
Study mode could not start. The page reads as usual.
Study mode
On this page
Section 01: What the IB course asks
The content statements for 3.5, in the platform's words, with the depth of teaching the guide sets (guide, from p. 29).
- Profitability ratios: gross profit margin, profit margin and return on capital employed (ROCE) AO2, AO4
- Strategies to improve the profitability ratios AO3
- Liquidity ratios: current ratio and acid test (quick) ratio AO2, AO4
- Strategies to improve the liquidity ratios AO3
AO1 knowledge and understanding · AO2 application and analysis · AO3 synthesis and evaluation · AO4 a range of skills. A question can use a command term at its statement's level or below. The whole course.
Section 02: Why it matters
A statement of profit or loss tells you that a business made $105,000 of profit before interest and tax. Is that good? It depends on how much the business sold to earn it, how much money was invested to earn it, and whether the business can still pay its bills. Ratio analysis answers those questions by comparing one figure in the accounts with another.
This subtopic covers the five ratios the guide sets for SL and HL: three profitability ratios, which show how well a business turns its sales and its capital into profit, and two liquidity ratios, which show whether it can pay the debts that fall due within a year. You need to calculate each one from the accounts, explain what it shows, and judge the strategies a business could use to improve it, including what each strategy costs.
By the end you can
- Calculate the gross profit margin, the profit margin and the return on capital employed from a set of final accounts.
- Calculate the current ratio and the acid test (quick) ratio, and explain what each shows about liquidity.
- Comment on a business's ratios by comparing them with earlier years and with other businesses.
- Evaluate strategies to improve the profitability ratios, weighing what each one costs.
- Evaluate strategies to improve the liquidity ratios, including those that change the cash position without moving the ratios.
Section 03: What ratio analysis is for
A ratio compares two figures from the final accounts, as a percentage or as a number to one. Comparing turns amounts into evidence. Profit of $105,000 is a great deal for a corner shop and very little for a chain of stores, but a profit margin of 10% means the same thing for both.
The guide groups the ratios into families. This subtopic covers the profitability and liquidity families, for SL and HL. The diagram also shows the efficiency family (stock turnover, debtor days, creditor days and the gearing ratio), which is HL only and belongs to 3.6.
A single ratio on its own says little. It becomes useful when it is compared:
- with the same business in earlier years, to show a trend;
- with competitors or the average for the industry, to show how the business is doing relative to others;
- with the business's own targets, to show whether it is on course.
- Profitability ratios
The gross profit margin, the profit margin and return on capital employed (ROCE). They show how much profit the business makes from its sales and from the capital invested in it.
- Liquidity ratios
The current ratio and the acid test (quick) ratio. They show whether the business can meet the debts due within a year from the assets it can turn into cash soon.
Text description
Three families of ratios with the guide’s formulas. Profitability: gross profit margin is gross profit divided by sales revenue times 100; profit margin is profit before interest and tax divided by sales revenue times 100; return on capital employed is profit before interest and tax divided by capital employed times 100. Liquidity: the current ratio is current assets divided by current liabilities; the acid test ratio is current assets minus stock, divided by current liabilities. Efficiency, for HL: stock turnover in times is cost of sales divided by average stock, or in days average stock divided by cost of sales times 365; debtor days are debtors divided by total sales revenue times 365; creditor days are creditors divided by cost of sales times 365; the gearing ratio is non-current liabilities divided by capital employed times 100. Capital employed is non-current liabilities plus equity, and average stock is opening plus closing stock divided by two.
Advantages
- Makes businesses of different sizes comparable, and one business across years in which its sales differed.
- Picks out trends and warning signs quickly, such as a falling margin or a weakening acid test ratio.
- Gives managers, banks and investors a common language for judging the same business.
- Helps to set targets and to check afterwards whether a strategy worked.
Limitations
- Shows what changed, not why. A falling margin can come from price cuts, dearer supplies or a change in what is sold.
- Uses past figures, and the statement of financial position shows a single day that can be window-dressed.
- Comparisons mislead when businesses work in different industries, use different accounting methods or have different year ends.
- Leaves out what is not in the accounts, such as the quality of staff and managers, the strength of the brand and the state of the market.
Section 04: Profitability ratios
Profitability is profit measured against something else. The two margins measure profit against sales revenue; ROCE measures it against the long-term capital invested in the business. Candidates receive the guide's formula list in the examination, so the marks go to choosing the right figures, showing the working and explaining the result.
The gross profit margin shows how much of each dollar of sales is left after paying for the goods or services sold, so it reflects prices and the direct cost of what is sold. The profit margin uses profit before interest and tax, so it also takes account of the expenses of running the business. The gap between the two margins is the share of sales taken by expenses: if the gross profit margin holds steady while the profit margin falls, the expenses are growing faster than sales.
ROCE compares profit before interest and tax with capital employed, the long-term finance provided by lenders and owners. It answers the question an investor asks: what return does the money tied up in this business earn? Compare it with what the same money could earn elsewhere, such as the interest on savings, and with the interest rate the business pays on its loans.
In the diagram, the fictional company's gross profit margin is (200 ÷ 500) × 100 = 40%, and its profit margin is (80 ÷ 500) × 100 = 16%, so expenses take 24 cents of every dollar of sales.
- What moves the gross profit margin
It falls if prices are cut or the cost of sales rises faster than revenue. It rises with higher prices, cheaper supplies, less waste, or a shift towards products with a bigger margin.
- What moves the profit margin
Everything that moves the gross margin, plus the expenses. Rent, salaries or marketing that grow faster than sales pull it down.
- What moves ROCE
It falls if profit falls, or if capital employed rises faster than profit, as it often does just after a business borrows or issues shares to invest. A ROCE below the interest rate the business pays on its loans is a warning sign.
Text description
A waterfall chart of a fictional company’s statement of profit or loss, in thousands of dollars. Sales revenue 500, less cost of sales 300, gives gross profit 200. Less expenses 120 gives profit before interest and tax 80. Less interest 10 gives profit before tax 70. Less tax 14, at 20%, gives profit for the period 56. Less dividends 20 leaves retained profit 36, which is kept in the business.
Gross profit margin
Gross profit margin = (gross profit ÷ sales revenue) × 100
Guide, p. 64. Gross profit is sales revenue minus cost of sales.
Profit margin
Profit margin = (profit before interest and tax ÷ sales revenue) × 100
Guide, p. 64. It uses profit before interest and tax, not profit before tax or the profit for the period.
Return on capital employed (ROCE)
ROCE = (profit before interest and tax ÷ capital employed) × 100
Guide, p. 64.
Capital employed
Capital employed = non-current liabilities + equity
The guide's definition (p. 64). Because the statement of financial position balances, it also equals total assets minus current liabilities, a useful check.
Section 05: Liquidity ratios
Liquidity is a business's ability to pay its debts as they fall due. A business can be profitable and still fail if it cannot pay its suppliers, its staff and its bank on time. The liquidity ratios compare the assets that will turn into cash within a year with the debts due within a year, both taken from the statement of financial position.
The current ratio counts all the current assets: cash, debtors and stock. The acid test ratio leaves out stock, because stock has first to be sold, often on credit, before it becomes cash, and some of it may never sell at full price. A wide gap between the two ratios shows that much of the business's liquidity is tied up in stock.
Both ratios are written as a number to one, for example 1.5 or 1.5:1. In the diagram, the fictional company's current ratio is 150 ÷ 70 = 2.14, and its acid test ratio is (150 − 70) ÷ 70 = 1.14.
- A current ratio below 1
Current liabilities are greater than current assets, so the business may struggle to pay its short-term debts without new finance.
- A current ratio of about 1.5 to 2
Often described as comfortable. This is a rule of thumb, not an IB rule, and what is normal differs between industries.
- An acid test ratio of about 1
The business could pay its short-term debts without selling any stock. Below 1, it is relying on its stock selling.
- Very high ratios
Not always good news. They can mean cash sitting idle and earning little, stock piling up, or customers slow to pay.
- The industry matters
A supermarket sells for cash every day, holds stock that sells within days and pays its suppliers weeks later, so it can run safely with ratios well below these figures. A builder that is paid only when each project ends needs far more.
Text description
Two columns of equal height for a fictional company, in thousands of dollars. What it owns: non-current assets 300, property, plant and equipment less accumulated depreciation, and current assets 150, made of cash 30, debtors 50 and stock 70; total assets 450. How it is financed: current liabilities 70, non-current liabilities 130 in long-term borrowings, and equity 250, made of share capital 150 and retained earnings 100. Net assets, total assets minus total liabilities, are 250, equal to total equity.
Current ratio
Current ratio = current assets ÷ current liabilities
Guide, p. 64.
Acid test (quick) ratio
Acid test (quick) ratio = (current assets − stock) ÷ current liabilities
Guide, p. 64. Stock is taken from current assets, not from current liabilities.
Section 06: Calculating and commenting: a worked example
Ratio questions reward a steady routine. Write the formula, substitute the figures from the accounts, and give the answer to two decimal places with its unit: a percentage for the profitability ratios, a number to one for the liquidity ratios. Then say what it means. Compare it with the earlier year or with a rival, give the likely cause, and say what follows for the business.
The example uses two years of accounts for one fictional retailer. Its 2025 statements are prepared in full in the notes on 3.4 Final accounts.
Section 07: Strategies to improve the profitability ratios
Every strategy works on one of three things: the price charged, the costs of making and selling, or the capital needed to earn the profit. None is free. Each has a cost, a risk or a stakeholder who loses, and the right choice depends on what caused the weak ratio, on the market and on the business's objectives. The strategies below are the usual options, not a list the IB prescribes.
- Raise prices
Lifts all three ratios if customers keep buying. The risk is lost sales. If customers are sensitive to price, or rivals hold their prices, revenue and profit can fall even as the margin rises.
- Cut the cost of sales
Cheaper suppliers, bulk buying, less waste or more productive staff lift the gross profit margin, and the profit margin and ROCE with it. But cheaper inputs can lower quality and harm the brand, bulk buying ties up cash in stock, and a new supplier may be less reliable.
- Control expenses
Cheaper premises, lower energy use, fewer layers of management or less advertising lift the profit margin and ROCE, though not the gross margin. Cuts can go too deep. Less marketing can mean lower sales next year, and job cuts can damage morale and service.
- Sell more of the higher-margin products
Shifting the product mix towards items with a bigger margin raises the average margin without changing any price. It depends on customers wanting those products, and dropping low-margin lines can lose customers who bought both.
- Increase sales volume
More sales spread the fixed expenses, such as rent and salaries, more thinly, which lifts the profit margin and ROCE. Winning the sales costs money first, in promotion or extra capacity, and price cuts to win volume lower the gross margin.
- Use less capital for the same profit
Selling assets the business does not need and using the money to repay long-term loans lowers capital employed, so ROCE rises on the same profit. But assets sold may be needed later, and a business that avoids investing to protect this year's ROCE may earn less in the future.
Section 08: Strategies to improve the liquidity ratios
The liquidity ratios rise when current assets rise or current liabilities fall. The quickest strategies bring in money from outside the everyday cycle of trading, from long-term finance or from selling assets the business does not need. Read each strategy for its effect on both ratios, and on cash, because they do not always move together.
Collecting debts faster, for example, turns debtors into cash. The business can pay its bills more easily, but current assets are unchanged, so neither ratio moves. Liquidity and the liquidity ratios are not quite the same thing. As with profitability, these are common options, not a list the IB prescribes, and each has a cost.
- Sell surplus stock
Turning slow-selling stock into cash raises the acid test ratio, because cash counts in it and stock does not. The current ratio stays the same if the stock sells at its recorded value, and falls slightly if it has to be discounted. The risks are selling stock that customers later want, and discounts that lower the gross profit margin.
- Sell non-current assets, or sale and leaseback
Selling property or equipment adds cash to current assets, so both ratios rise. With sale and leaseback the business keeps using the asset, but it takes on years of lease payments and gives up an asset that could have secured a loan.
- Turn an overdraft into a long-term loan
Moving the debt out of current liabilities raises both ratios at once. The business is committed to interest for several years and to the lender's conditions, and it owes exactly as much as before.
- Raise long-term finance
New share capital, or a long-term loan, held as cash raises both ratios. New shares dilute the owners' control; a loan adds interest and, at HL, raises gearing.
- Retain more profit
Paying smaller dividends keeps cash in the business and builds up current assets over time. Shareholders who rely on dividends may object, and it is slow.
- Collect debts sooner, or use debt factoring
Chasing late payers, shortening credit terms or factoring turns debtors into cash sooner. That helps the cash position, but on its own it leaves both ratios unchanged, and a factor's fee even reduces current assets slightly. Tighter credit terms may also send customers to rivals.
- Pay suppliers later
Keeps cash in the bank for longer, but the debt stays in current liabilities, so the ratios do not improve, and suppliers may tighten their terms. It is a way of managing cash flow (3.7), not a cure for weak liquidity.
Section 09: In practice: industries and stakeholders
The same ideas look different from one industry to the next, and land differently on each group with a stake in the business.
Across industries
- Supermarkets and grocery retail
Competition is on price, so gross profit margins are low and profit comes from volume; a small slip in the margin moves profit a long way. Customers pay at the till while suppliers are paid weeks later, so a current ratio below 1 is normal and safe, as long as the stock keeps selling quickly.
- Software and online services
Serving one more customer costs little, so gross profit margins are usually high, but developers, sales staff and marketing sit in expenses, so the profit margin can be low or negative while the business grows. Because it needs few physical assets, a mature software business can earn a high ROCE, unless it holds large cash balances from share issues, which raise capital employed without adding profit.
- Manufacturing
Factories and machinery tie up a large capital employed, so ROCE is the ratio owners watch most closely, and a new production line can depress it for a year or two before its profit arrives. Stock is held as materials, work in progress and finished goods, which opens a wide gap between the current ratio and the acid test ratio.
- House building
Land, half-built homes and materials are all stock, so a builder's acid test ratio is often far below its current ratio, and its liquidity depends on selling homes on time. A delayed project or a slow housing market leaves it paying wages and suppliers while its cash is locked in unsold stock.
- Hotels and restaurants
Food and drink stock is small and perishable, so the acid test ratio sits close to the current ratio, while buildings and fittings make capital employed large. Many costs, such as staff and premises, are fixed, so profit margins swing with occupancy, and a quiet season can turn a healthy margin into a loss.
- Social enterprises
A social enterprise reinvests its surplus in its mission, so it may accept a lower profit margin than a commercial rival, and ROCE serves less as a goal than as a check that capital is not being wasted. Lenders and grant-makers still look hard at liquidity, because an organization that cannot pay its bills cannot pursue any mission.
For each stakeholder
- Shareholders and investors
Compare ROCE with what their money could earn elsewhere and with the interest rate the business pays, and watch the margins for trends. They may press for strategies that lift ROCE quickly, such as selling surplus assets or cutting costs, which can conflict with managers who want to invest for the long term.
- Banks and other lenders
Read the liquidity ratios first, to judge whether short-term debts can be met, then ROCE against the interest rate, to judge whether borrowed money earns its keep. A lender worried about liquidity may restrict dividends, raise its charges or ask for repayment, which sets it against shareholders who want a payout.
- Suppliers
Check the acid test ratio before giving trade credit, because a weak one warns that the business needs its stock to sell before it can pay them. Delaying payment to suppliers keeps cash in the business but leaves current liabilities unchanged, so it does not improve the ratios, and a supplier that sees liquidity weakening may shorten its terms or ask for payment in advance.
- Managers
Use the margins to find where costs are rising, and ROCE to judge divisions and projects. When a bonus depends on a ratio, they may manage the ratio rather than the business, for example by postponing a worthwhile investment because it would lower ROCE for a year.
- Employees and trade unions
Strategies to lift the margins often fall on labour, through pay freezes, fewer staff or more work for each person. A rising profit margin strengthens a pay claim, so employees and shareholders read the same ratio as evidence for opposite conclusions.
- Customers
A price rise is the quickest way to lift every profitability ratio, and customers pay for it; cheaper inputs can lower quality. In a competitive market they can switch to rivals, which limits how far a business can raise its margins at their expense.
Section 10: Evaluation and limits
What to weigh before reaching a judgement.
- A ratio is a question, not an answer. It shows that something has changed; the cause has to come from the business's situation. A falling gross profit margin might mean price cuts to win market share, which may be a sound strategy, or rising supplier prices, which is a problem.
- Profitability and liquidity can pull in opposite directions. Holding plenty of cash and stock makes the liquidity ratios look safe but earns little and lowers ROCE; squeezing stock and cash to raise returns leaves no buffer. A business needs enough liquidity to survive and enough profitability to be worth running, and one that is short of cash must put survival first.
- The benchmark decides the verdict. A current ratio of 0.8 is a warning for a manufacturer but normal for a supermarket, and a gross profit margin of 30% is high for a grocer but low for a software company. Compare with the same business over time and with similar businesses, not with an ideal number.
- The ratios are only as honest as the accounts. Because the statement of financial position shows a single day, a business can lift its liquidity ratios by selling assets or delaying stock purchases just before the year end, and it can lift its profit with generous estimates. This window dressing is harder to hide in ratios taken over several years.
- Ratios use the past and leave out what is not in the accounts, such as a new competitor, a large contract about to end, the quality of management or the morale of the staff. Use them alongside the other evidence in a case, and say what they cannot show.
- Different readers look at different ratios. A bank or a supplier deciding whether to give credit looks first at liquidity; a shareholder looks at ROCE; managers look at the margins to find which costs to control. A good answer says whose decision the ratios are informing.
Section 11: Make the decision
Use the ideas on a business choice: weigh the options, decide, and say what would change your mind.
Decision brief · a fictional business
Answering the bank
Tidewater Outdoors' 2026 accounts, in the worked example above, show every ratio weaker than in 2025: the gross profit margin down from 55.95% to 50.00%, ROCE from 26.67% to 14.34% and the acid test ratio from 1.07 to 0.55. The causes are clear enough. The new store opened with heavy discounts, and stock has risen to $125,000 while cash has fallen to $5,000.
Its current liabilities of $118,000 are trade creditors of $70,000, a bank overdraft of $38,000 and other short-term loans of $10,000; expenses were $420,000. The bank wants to know what the directors will do, and they can put management time and money behind one main strategy this year.
How to weigh the options
Match each option to the cause it treats. The acid test ratio collapsed because cash went into stock that has not sold; the margins fell because of the opening discounts. Clearing the stock treats the first cause, ending the discounts treats the second, and converting the overdraft treats neither: it moves a debt from one line of the statement of financial position to another.
Clearing the stock is the most direct cure for liquidity. It turns slow-moving stock into cash at once and lifts the acid test ratio by more than half, at the price of a $10,000 loss and a weaker margin this year. It also improves the cash position, not just the ratio, which matters if suppliers are pressing for payment. Ending the discounts treats the deeper problem: at a 54% gross margin, ROCE would be back above 20%. But it rests entirely on how customers respond to higher prices, which nobody yet knows, and it does nothing for cash this month. Converting the overdraft gives the best-looking current ratio and removes the risk of the bank withdrawing the overdraft at short notice, but the business is no more liquid in fact, it commits to three years of interest, and ROCE falls a little further.
With $5,000 in the bank, liquidity is the urgent problem, so a strong answer usually puts it first: clear the stock, or convert the overdraft if the bank offers fair terms, while testing the end of the discounts gradually, on a few ranges, to see how customers react. The judgement would change with evidence on how sensitive the new store's customers are to price, whether the surplus stock would sell at full price next season, and the interest rate on the loan.
Section 12: Exam-style practice
Original questions written by the platform in the style of the papers, with what a strong response does. They are not IB questions and the guidance is not an official markscheme.
-
Define the term liquidity.
What a strong response does
A strong response gives a precise definition: a business's ability to pay its short-term debts as they fall due, from its cash and from the assets it can turn into cash quickly.
- A complete definition includes the idea of paying debts as they fall due, or within the coming year.
- Confusing liquidity with profitability, or defining it only as "having cash", earns little.
-
Saltmere Ceramics Ltd, a fictional maker of tableware, reports these figures for 2025, in $000: sales revenue 940; cost of sales 611; expenses 216; non-current liabilities 180; equity 520; cash 12; debtors 88; stock 150; current liabilities 190.
Calculate Saltmere's profit margin and its return on capital employed (ROCE) for 2025.
What a strong response does
A strong response writes each formula from the guide, substitutes the figures, and gives each result as a percentage to two decimal places.
- Gross profit = 940 − 611 = 329; profit before interest and tax = 329 − 216 = 113.
- Profit margin = (113 ÷ 940) × 100 = 12.02%.
- Capital employed = non-current liabilities + equity = 180 + 520 = 700.
- ROCE = (113 ÷ 700) × 100 = 16.14%.
The usual error is to use gross profit, or a profit after interest, in place of profit before interest and tax.
-
Using the figures in question 2, calculate Saltmere's current ratio and acid test (quick) ratio for 2025.
What a strong response does
A strong response shows the working and writes each ratio as a number to one.
- Current assets = 12 + 88 + 150 = 250.
- Current ratio = 250 ÷ 190 = 1.32.
- Acid test ratio = (250 − 150) ÷ 190 = 100 ÷ 190 = 0.53.
Stock is taken away from current assets, not from current liabilities, and neither ratio is a percentage.
-
In 2024, Saltmere's gross profit margin was 38.20%, its profit margin 14.50%, its ROCE 18.30%, its current ratio 1.65 and its acid test ratio 0.92. During 2025 it agreed lower prices with a hotel chain that now buys a third of its output, and it bought a year's supply of clay and glazes in bulk ahead of a supplier's price rise.
Using your answers to questions 2 and 3, comment on the changes in Saltmere's profitability and liquidity.
What a strong response does
A strong response links each change in the ratios to a cause in the case and says what follows.
- Profitability. The gross profit margin fell from 38.20% to 35.00% (329 ÷ 940 × 100), consistent with the lower prices agreed with the hotel chain. Expenses took a slightly smaller share of sales, 22.98% against 23.70%, so the fall in the profit margin, from 14.50% to 12.02%, came from the gross margin, not from overheads. ROCE fell from 18.30% to 16.14%; whether that is enough depends on the interest rate Saltmere pays and on what similar businesses earn, which the case does not give.
- Liquidity. The acid test ratio fell much further than the current ratio, from 0.92 to 0.53 against 1.65 to 1.32, because the bulk purchase moved cash into stock, which the acid test ratio leaves out. With $12,000 of cash against $190,000 of current liabilities, Saltmere relies on selling stock and collecting $88,000 from its debtors to pay its bills.
- A strong comment adds a judgement: the bulk purchase may pay for itself once the supplier's prices rise, but the lower margin on a third of output, from one customer, is the change to watch.
-
Explain two strategies Saltmere could use to improve its acid test ratio.
What a strong response does
A strong response explains how each strategy changes the parts of the ratio, applies it to Saltmere and notes a drawback.
- Sell some of the surplus stock. Stock is left out of the acid test ratio, so turning it into cash raises the ratio. Selling $40,000 of stock at its recorded value would lift the ratio from 0.53 to (250 − 110) ÷ 190 = 0.74. But the bulk purchase was meant to beat a price rise, so Saltmere might later have to buy the same clay at the higher price.
- Replace short-term borrowing with long-term finance. If part of the current liabilities is an overdraft or a short-term loan, moving it into a long-term loan lowers current liabilities and raises both liquidity ratios. The debt remains, with interest to pay for several years.
- Raising share capital held as cash, or selling an unneeded non-current asset, are also valid. Collecting debts faster helps cash but leaves the acid test ratio unchanged, because debtors and cash both count in it.
-
Saltmere's directors want to restore the profit margin to at least its 2024 level. Evaluate two strategies they could use to improve Saltmere's profitability.
What a strong response does
A strong response analyses two strategies in Saltmere's situation, uses the figures, weighs each and reaches a judgement.
- The size of the gap. Each percentage point of gross profit margin on sales of $940,000 is worth $9,400 of gross profit. Recovering the 2024 gross margin of 38.20% would add $30,080, lifting profit before interest and tax from $113,000 to $143,080 and the profit margin to 15.22%, if expenses stayed the same.
- Strategy 1: raise prices, or renegotiate the hotel contract. This attacks the cause of the fall directly. But the hotel chain takes a third of output, so pressing it too hard risks losing a customer whose sales are worth far more than the margin regained, and other customers may also resist higher prices.
- Strategy 2: cut the cost of sales. Less kiln waste, cheaper glazes or the savings the bulk purchase should bring would lift the gross margin without touching any customer's price. But cheaper materials risk quality, which matters for tableware sold to hotels, and further bulk buying ties up cash that the weak acid test ratio shows Saltmere can ill afford.
- Other routes, such as shifting sales towards higher-margin products, controlling expenses or selling surplus assets to lower capital employed, are also valid when they are applied to the case.
- Judgement. For example, that cutting the cost of sales is the safer first step because it does not put the largest customer at risk, with a price review when the hotel contract is renewed; or the reverse, if the hotel contract barely covers its costs. The answer turns on the hotel chain's alternatives and on how far costs can fall before quality suffers.
Section 13: Revision summary
The subtopic on one page: what to remember.
- A ratio compares two figures from the final accounts. It becomes evidence only when it is compared with earlier years, with rivals or with targets.
- Gross profit margin = (gross profit ÷ sales revenue) × 100, which reflects prices and the direct cost of what is sold.
- Profit margin = (profit before interest and tax ÷ sales revenue) × 100. The gap below the gross margin is the share of sales taken by expenses.
- ROCE = (profit before interest and tax ÷ capital employed) × 100, where capital employed = non-current liabilities + equity. Compare it with the interest rate and with other uses of the money.
- Current ratio = current assets ÷ current liabilities, and acid test ratio = (current assets − stock) ÷ current liabilities, both written as a number to one.
- What counts as safe depends on the industry, and very high liquidity ratios can mean idle cash or stock piling up.
- Profitability improves through price, the cost of sales, expenses, the product mix, volume or using less capital, and every route has a cost or a stakeholder who loses.
- The liquidity ratios rise when current assets rise or current liabilities fall. Collecting debts sooner or paying suppliers later changes the cash position but not the ratios.
- Ratios show what changed, not why. They rest on past figures that may be window-dressed, and leave out what the accounts cannot measure.
Section 14: The mindmap
The five ratios that show how profitable a business is and whether it can pay its short-term debts, how to improve each, and what ratios cannot tell you.
Drag to move the map, or use the arrow keys. Click a branch to fold it away. Whole map shows all of it; zoom with the buttons, or with Ctrl and the scroll wheel.
- Core ideas
- Calculations
- Evaluation
- Advantage
- Limitation
- HL HL only
The map as an outline
Ratio analysis
Core ideas
- Definition Comparing figures from the final accounts
- Definition Profitability: profit relative to sales or capital
- Definition Liquidity: ability to pay short-term debts
- Compare with past years, rivals and targets A single ratio means little on its own.
Profitability ratios
Calculations
- Formula Gross profit margin Gross profit margin = (gross profit ÷ sales revenue) × 100
- Formula Profit margin Profit margin = (profit before interest and tax ÷ sales revenue) × 100
- Formula Return on capital employed (ROCE) ROCE = (profit before interest and tax ÷ capital employed) × 100
- Formula Capital employed Capital employed = non-current liabilities + equity
- The gap between the margins is the expenses A steady gross margin with a falling profit margin points to rising overheads.
Improving profitability
Evaluation
- Raise prices
- Limitation Customers may buy less or switch to rivals
- Cut the cost of sales
- Example Cheaper suppliers, bulk buying, less waste
- Limitation Cheaper inputs can lower quality
- Control expenses
- Example Cheaper premises, energy saving, efficient staffing
- Use less capital for the same profit Selling idle assets to repay long-term debt lowers capital employed and lifts ROCE.
Liquidity ratios
Calculations
- Formula Current ratio Current ratio = current assets ÷ current liabilities About 1.5 to 2 is often called comfortable; norms vary by industry.
- Formula Acid test (quick) ratio Acid test (quick) ratio = (current assets − stock) ÷ current liabilities About 1 or more; stock is left out because it is the least liquid.
- Limitation Too low: bills may go unpaid
- Limitation Too high: idle cash, stock or debtors
Improving liquidity
Evaluation
- Sell surplus stock or assets for cash
- Sale and leaseback
- Collect debts sooner, or use debt factoring
- Turn an overdraft into a long-term loan The debt moves out of current liabilities.
- Raise long-term finance or retain more profit
- Limitation Liquidity and profitability can pull apart Cash held for safety earns little; selling assets cheaply hurts profit.
Limits of ratio analysis
Evaluation
- Limitation Based on past figures and a single date
- Limitation Means little without a benchmark
- Limitation Window dressing can distort the figures
- Limitation Shows what changed, not why
- Limitation Leaves out qualitative factors Brand strength, staff morale and market trends do not appear in the ratios.
Open the mindmap on its own page, with its terms and connections.
Section 15: More diagrams
Original diagrams from the platform's library, each with a text description and an SVG download.
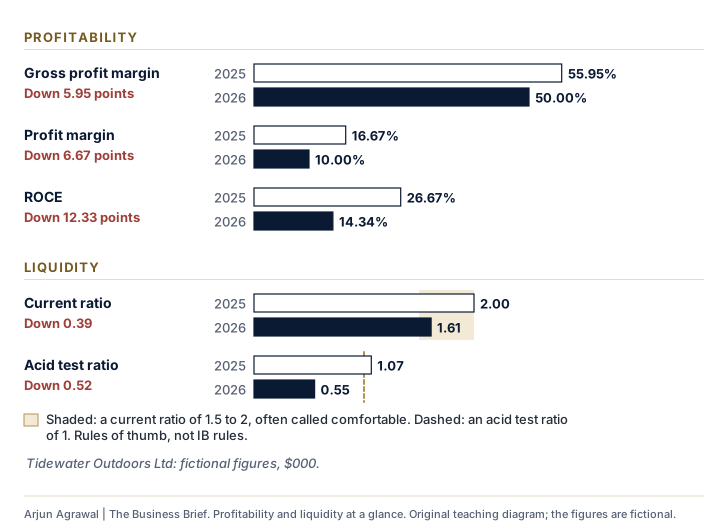
Change the 2026 figures; the ratios, the chart and the reading follow.
| Ratio | 2025 | 2026 | Change |
|---|---|---|---|
| Gross profit margin | 55.95% | 50.00% | Down 5.95 points |
| Profit margin | 16.67% | 10.00% | Down 6.67 points |
| ROCE | 26.67% | 14.34% | Down 12.33 points |
| Current ratio | 2.00 | 1.61 | Down 0.39 |
| Acid test ratio | 1.07 | 0.55 | Down 0.52 |
In 2026, gross profit margin, profit margin, ROCE, current ratio and acid test ratio are lower than in 2025. The acid test ratio is below 1: without selling stock, the business could not pay all its short-term debts. A ratio says what changed; the accounts and the business's situation explain why.
The figures above are the example’s. With JavaScript on, they can be changed here.
Text description
Tidewater Outdoors Ltd, a fictional retailer, in 2025 and 2026. Gross profit margin: 55.95% in 2025, 50.00% in 2026, down 5.95 points. Profit margin: 16.67% in 2025, 10.00% in 2026, down 6.67 points. ROCE: 26.67% in 2025, 14.34% in 2026, down 12.33 points. Current ratio: 2.00 in 2025, 1.61 in 2026, down 0.39. Acid test ratio: 1.07 in 2025, 0.55 in 2026, down 0.52. A current ratio of about 1.5 to 2 is often called comfortable, and an acid test ratio of about 1 means short-term debts could be paid without selling stock; both are rules of thumb, not IB rules.
Section 16: Key terms
Defined in the platform's own words. Each opens its full entry.
- Acid test (quick) ratio
- Current assets minus stock, divided by current liabilities; a stricter test of liquidity that leaves out stock because it is the slowest current asset to turn into cash.
- Capital employed
- The long-term finance used by a business, made up of its non-current liabilities and its equity.
- Current assets
- Cash and the other assets a business expects to turn into cash or use up within a year; in the guide's layout these are cash, debtors and stock.
- Current liabilities
- Debts a business must pay within a year; in the guide's layout these are the bank overdraft, trade creditors and other short-term loans.
- Current ratio
- Current assets divided by current liabilities, which shows how many times the assets that will become cash within a year cover the debts due within a year.
- Equity
- The owners' stake in the business, which in the guide's layout is share capital plus retained earnings and always equals net assets.
- Gross profit
- Sales revenue minus cost of sales, the profit a business makes on its trading before the expenses of running it are paid.
- Gross profit margin
- Gross profit as a percentage of sales revenue, which shows how much of each dollar of sales is left after paying for the goods or services sold.
- Liquidity
- A business's ability to pay its short-term debts as they fall due from its cash and the assets it can quickly turn into cash; for a single asset, how quickly it can become cash at close to its full value.
- Non-current liabilities
- Debts a business does not have to repay within the next year, such as long-term bank loans, mortgages and debentures; the guide's layout shows them as long-term borrowings.
- Profit before interest and tax
- Gross profit minus expenses, the profit from the business's operations before the cost of borrowing (interest) and tax are taken off.
- Profit margin
- Profit before interest and tax as a percentage of sales revenue, which shows how much of each dollar of sales is left after all the costs of running the business, before interest and tax.
- Profitability
- How well a business turns its sales, or the capital invested in it, into profit, measured with ratios rather than by the amount of profit alone.
- Ratio analysis
- Comparing one figure from the final accounts with another, as a percentage, a ratio, a number of times or a number of days, to judge a business's performance and financial health.
- Return on capital employed (ROCE)
- Profit before interest and tax as a percentage of capital employed, which shows how much profit a business earns on the long-term finance invested in it.
- Stock
- The goods a business holds, including raw materials and components waiting to be used, work in progress and finished goods waiting to be sold; a current asset.
- Working capital
- Current assets minus current liabilities, the resources a business has for its day-to-day running once its short-term debts are allowed for.
Section 17: Tools and practice
8 tools on the platform for 3.5, by room, with exercises, worked calculations and practice questions.
Advanced financial analysis
- Financial performance dashboard Enrichment
- Integrated forecast Enrichment
Section 18: Check your recall
Answer from memory, then reveal and rate yourself. Your ratings stay on this device.
Answer each question from memory, out loud or on paper, before you reveal the answer. Your ratings also schedule these questions in your flashcards.
-
State the formula for ROCE, and the guide's definition of capital employed.
ROCE = (profit before interest and tax ÷ capital employed) × 100, where capital employed = non-current liabilities + equity.
How well did you recall it? -
Which profit figure do the profit margin and ROCE both use?
Profit before interest and tax.
How well did you recall it? -
Why does the acid test ratio leave out stock?
Stock is the least liquid current asset. It has to be sold, often on credit, before it becomes cash, and some may not sell at its full value.
How well did you recall it? -
A business's gross profit margin is steady but its profit margin has fallen. What does this suggest?
Its expenses (overheads) have grown faster than its sales, so they take a bigger share of each dollar of revenue.
How well did you recall it? -
Current assets are $90,000, of which stock is $30,000, and current liabilities are $60,000. Calculate the current ratio and the acid test ratio.
Current ratio = 90,000 ÷ 60,000 = 1.50. Acid test ratio = (90,000 − 30,000) ÷ 60,000 = 1.00.
How well did you recall it? -
Give one strategy to improve the profit margin, and its main drawback.
For example, raise prices (customers may buy less or switch to rivals) or cut expenses (less marketing or fewer staff can reduce sales or service).
How well did you recall it? -
Why does collecting money from debtors leave the current ratio unchanged?
Debtors and cash are both current assets, so turning one into the other leaves current assets, and the ratio, the same. The cash position improves, but the ratio does not move.
How well did you recall it? -
How can ROCE fall just after a business makes a sound investment?
Capital employed rises at once, through the new loan or shares, while the extra profit from the investment arrives later.
How well did you recall it?
Section 19: How it connects
Where 3.5 meets the rest of the course: worked connections with an exam-style question on each, then the further links the notes name.
-
With 3.7 Cash flow
Liquidity ratios and cash flow
The current ratio and the acid test ratio measure liquidity on one date, while a cash flow forecast shows how the cash position will change month by month. A business with cash flow problems often shows them in its ratios: cash falls, short-term debts such as an overdraft and trade creditors rise, and the acid test ratio drops below a comfortable level. Strategies that improve one usually improve the other, such as collecting debts sooner, reducing stock or replacing an overdraft with a long-term loan, though each has a cost.
Exam-style question Source: Original practice question Command term: Explain (AO2)
Explain how a cash flow problem might show up in a business's current ratio and acid test ratio. [4 marks]
-
With 4.5 The seven Ps of the marketing mix
Marketing decisions and financial performance
Every choice in the marketing mix reaches the statement of profit or loss. A price cut lowers revenue per unit, so unless sales rise strongly it lowers the gross profit margin; a premium price can raise the margin if customers accept the brand's value. Promotion is an expense, so a campaign lowers the profit margin in the year it is paid for, and the gain comes only if the extra sales cover its cost. Because ROCE is calculated from profit before interest and tax, the same decisions move it too. Ratio analysis is one way to judge a marketing decision after the event, and a reason to estimate its financial effect before it is made.
Exam-style question Source: Original practice question Command term: Discuss (AO3)
Discuss the likely effects of a decision to use penetration pricing on a business's gross profit margin and profit margin. [10 marks]
Also linked in the notes
- 1.3 Business objectives Profitability ratios measure progress towards profit objectives.
- 1.4 Stakeholders Each stakeholder reads the ratios that bear on its own decision.
- 3.4 Final accounts The statement of profit or loss and the statement of financial position that the ratios are calculated from.
- 3.6 Efficiency ratio analysis At HL, the efficiency ratios and the gearing ratio complete the analysis.
See 3.5 on the course connections map, with every link drawn across the five units.
Section 20: Connected learning
Everything else on the platform that teaches, applies or tests 3.5, each labelled by its standing.
- Revise
-
- The 3.5 mindmap Full and revision views, to print or download
- Revision sheet The subtopic on one printable page
- Flashcards The 3.5 cards, to rate as you go
- Practise
-
- 9 questions on 3.5 in the question bank From the practice sets, the notes and the case files, filtered to this subtopic
- Cases
-
- Bellbird Home and Garden Fictional Case Vault
- Larkspur Software Fictional Case Vault
- Decisions and simulations
-
- Kestle Cycles: the cash runs out first Fictional Boardroom simulation
- Hotel Mareluce: full rooms or a future Fictional Boardroom simulation
- Corvell Furniture: three years to restore the margin Fictional Boardroom simulation
- Tools
-
- 8 tools for 3.5 In Tools and practice on this page: Finance Desk, Financial Laboratory, Advanced financial analysis
- Boardroom Briefings
-
- Kittiwake Air's margins fall for a third year Fictional Briefing 3
- Scholarline's tutors meet a tutor that never sleeps Fictional Briefing 7
- Business Intelligence
-
- Engine inspections keep Wizz Air jets on the ground as its annual profit falls to €1.3 million Real-world A real development, 11 June 2026, with its sources
- Advanced Management
-
- Financial statement analysis Enrichment Advanced financial management: beyond the IB course
- Course connections
-
- 2 worked connections on the connections map With 3.7, 4.5
Notes checked against: Business management guide, first assessment 2024 (published February 2022, updated May 2022), pp. 29, 59, 61, 64 (The four content statements and their assessment objectives (p. 29), the statement layouts the figures come from (pp. 59 and 61), and every ratio formula with the definition of capital employed (p. 64)); Business management teacher support material, pp. 82, 85 (The glossary entries for current assets, current liabilities and liquidity, read to check terms; nothing reproduced). Updated 2026-11-03. The IB guide is the authority on the course.
Arjun Agrawal | The Business Brief, https://the-business-brief-dun.vercel.app/topics/profitability-and-liquidity-ratio-analysis/. Original teaching material, not an IB publication. The organizations in the teaching cases are fictional unless a case says otherwise.